Research Projects and Scientific Experience
Data mining algorithms to find small earthquakes
Collaborators:
In recent years, computer scientists have developed methods to efficiently search for matching items within massive databases. Applications include finding duplicate webpages with a search engine (Google), searching for copyright content violations in videos (YouTube), and music recognition apps (Shazam, SoundHound).
Why not search for matching earthquakes using the same methods? Template matching is successfully used by many seismologists to detect smaller earthquakes with similar waveforms as the template (usually taken from the earthquake catalog). Our team wanted to generalize template matching to search for all possible similar earthquakes within many years of continuous seismic data. For large data sets, this search could take longer than a human lifetime if implemented in a naive brute-force fashion (such as autocorrelation: Brown et al., 2008), even with parallel processing. Therefore, we needed a smarter way to do this.
 |
|---|
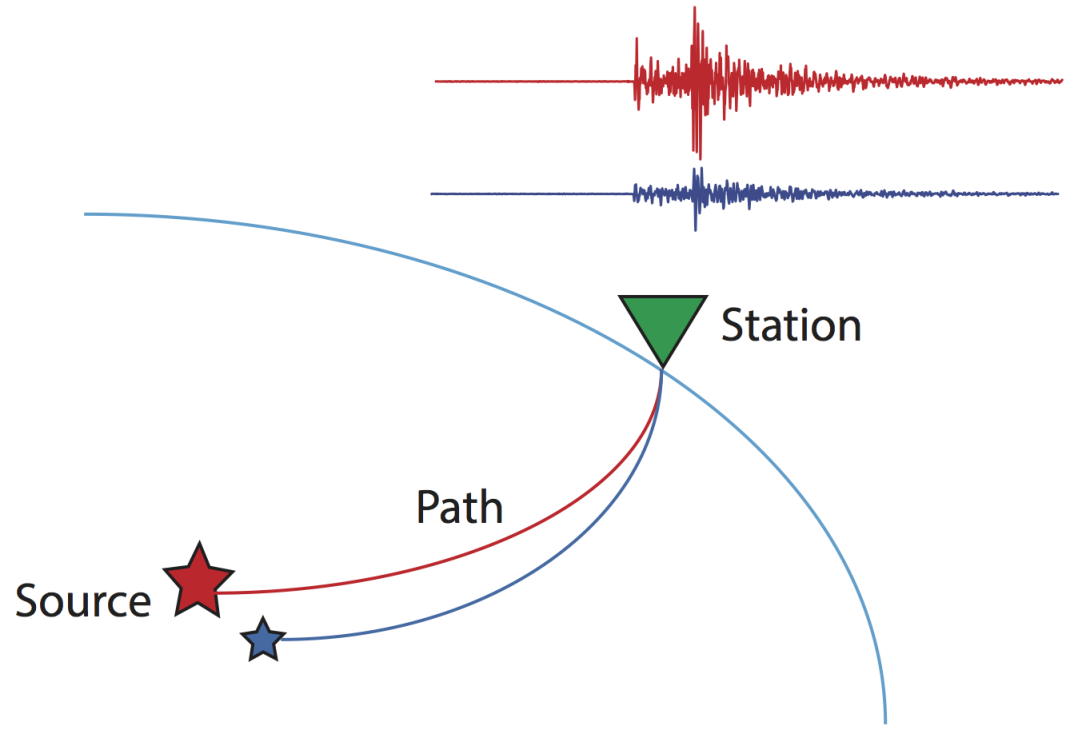
| Nearby earthquakes with the same mechanism have similar waveforms when recorded at the same station, even if they happened a decade apart in time. Can we find all such earthquakes in continuous seismic data? |
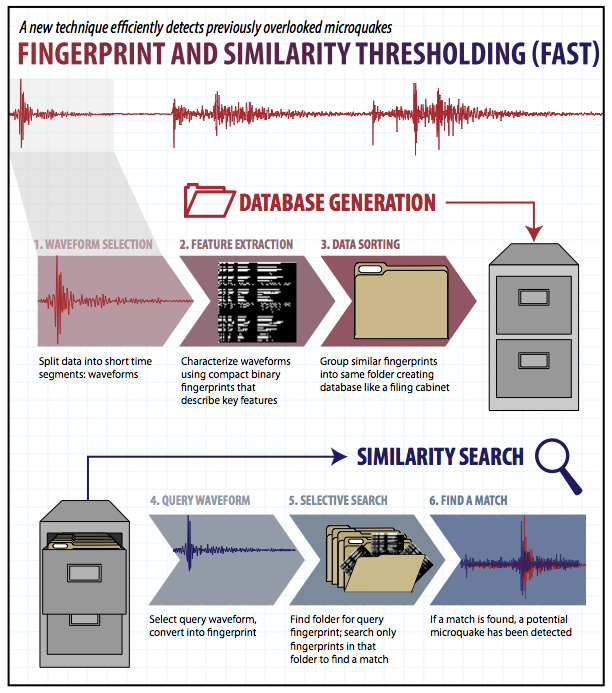
We developed the Fingerprint And Similarity Thresholding (FAST) earthquake detection algorithm, adapting the Waveprint audio recognition algorithm developed by Google researchers. FAST converts every waveform from continuous seismic data into its "fingerprint", a compact string of 0s and 1s that preserve similarity information. All fingerprints are organized into groups inside a database with locality-sensitive hashing (LSH), like the way files are organized inside folders within a giant file cabinet. Searching for a matching fingerprint (and therefore waveform) is very efficient, because we only need to search within a single group (folder) instead of comparing against the 99.999% of other fingerprints that are not similar anyway. We set a minimum threshold on the similarity between pairs of fingerprints to classify a detection as an earthquake.
 |
|---|
| Ilissa Ocko created this infographic to explain FAST earthquake detection. |
We tested our prototype MATLAB/Python/C++ FAST application on a week of continuous seismic data at one seismic station near the Calaveras Fault in central California, and successfully detected small aftershocks of a Mw 4.1 earthquake that were missing from the Northern California earthquake catalog. Compared to a brute-force autocorrelation search, FAST ran 140 times faster while finding about the same number of earthquakes, which demonstrated the utility and potential for efficiently detecting small earthquakes in larger data sets.
Publications:
- Yoon, C. E., O. O'Reilly, K. J. Bergen, and G. C. Beroza (2015). Earthquake detection through computationally efficient similarity search, Science Advances, 1, e1501057, https://doi.org/10.1126/sciadv.1501057. [Download PDF] [Download Supplementary PDF]
- Bergen, K., C. Yoon, and G. C. Beroza (2016). Scalable Similarity Search in Seismology: A New Approach to Large-Scale Earthquake Detection, Proceedings, Similarity Search and Applications: 9th International Conference, SISAP 2016, Tokyo, Japan (conference paper), https://doi.org/10.1007/978-3-319-46759-7_23. [Download PDF]
Presentations (Oral):
- Earthquake Detection Through Computationally Efficient Similarity Search (with K. Bergen), U.S. Geological Survey Earthquake Science Center Seminar, Menlo Park, CA, August 2015, https://earthquake.usgs.gov/contactus/menlo/seminars/999.
- Yoon, C. E., O. J. O'Reilly, K. Bergen, and G. C. Beroza, Computationally Efficient Search for Similar Seismic Signals in Continuous Waveform Data over a Seismic Network, 2014 AGU Meeting, Abstract S52A-04.
- Yoon, C. E., O. J. O'Reilly, and G. C. Beroza, Waveform Fingerprinting for Efficient Seismic Signal Detection, 2013 AGU Meeting, Abstract S21D-02.
Presentations (Poster):
- Bergen, K., C. E. Yoon, O. J. O'Reilly, and G. C. Beroza, Unsupervised Approaches for Post-Processing in Computationally Efficient Waveform-Similarity-Based Earthquake Detection, 2015 AGU Meeting, Abstract S53A-2777.
- Bergen, K., C. Yoon, O. O'Reilly, Y. Huang, and G. Beroza, Fingerprint and Similarity Thresholding (FAST) for Computationally Efficient Earthquake Detection, 2015 SCEC Meeting, Abstract 132.
- Yoon, C., O. O'Reilly, K. Bergen, and G. Beroza, Computationally Efficient Earthquake Detection with Continuous Seismic Waveform Data, Stanford-USTC-MIT (SUM) Geoscience Summer Camp, Hefei, China, September 2015.
- Yoon, C., O. O'Reilly, K. Bergen, and G. Beroza, Computationally Efficient Earthquake Detection with Continuous Seismic Waveform Data, 9th International Workshop on Statistical Seismology (Statsei9), Potsdam, Germany, June 2015.
- Yoon, C., O. O'Reilly, K. Bergen, and G. Beroza, Computationally Efficient Search for Similar Seismic Signals in Continuous Waveform Data over the Northern California Seismic Network, 2014 SCEC Meeting, Abstract 162.
- O'Reilly, O. J., C. E. Yoon, and G. C. Beroza, Similarity Search for Continuous Seismic Data, 2013 AGU Meeting, Abstract S11B-2319.
- O'Reilly, O. J., C. E. Yoon, and G. C. Beroza, Similarity Search for Continuous Seismic Data, 2013 SCEC Meeting, Abstract 107.
Media Coverage:
- Stanford scientists develop 'Shazam for earthquakes' (Stanford News)
- Seismic Tools to Map Earthly Microquakes and Martian Dust Devils (IEEE Spectrum)
- Stanford Scientists Create an Algorithm That Is the "Shazam" For Earthquakes (Smithsonian Magazine)
- 'Shazam for Earthquakes': Scientists Use Tones and Beats to Detect Microquakes (NBC Bay Area)
Unsupervised large-scale search for similar earthquake signals
Collaborators:
-
Kexin Rong, Hashem Elezabi, Peter Bailis, Philip Levis (Stanford University, Computer Science)
-
Greg Beroza, Bill Ellsworth (Stanford University, Geophysics)
We are currently in the age of "big data", and earthquake seismology is no exception. The volume of seismic data is accelerating as the cost of sensors goes down. A timely challenge for seismologists is to develop new scalable algorithms and techniques to efficiently and automatically extract as much useful information as possible from these large data volumes.
What kind of unforeseen patterns and signals are hidden in continuous seismic data, waiting to be discovered? Are we missing tiny earthquakes from existing catalogs that might tell us something about the possibility of larger earthquakes, or provide insight into seismic hazards?
Some seismic stations have recorded continuous data for over a decade ("large-T" seismology). Our team developed a high-performance, optimized, parallel version of the FAST software to perform a blind search for all similar-waveform earthquakes within years of continuous seismic data. FAST can also use data from a network of multiple seismic stations to detect earthquakes, eliminating false positive detections (Bergen and Beroza, 2018). This is an example of unsupervised machine learning, where we look for patterns of similar signals within an unexplored data set, without needing prior knowledge of earthquake sources in the area.
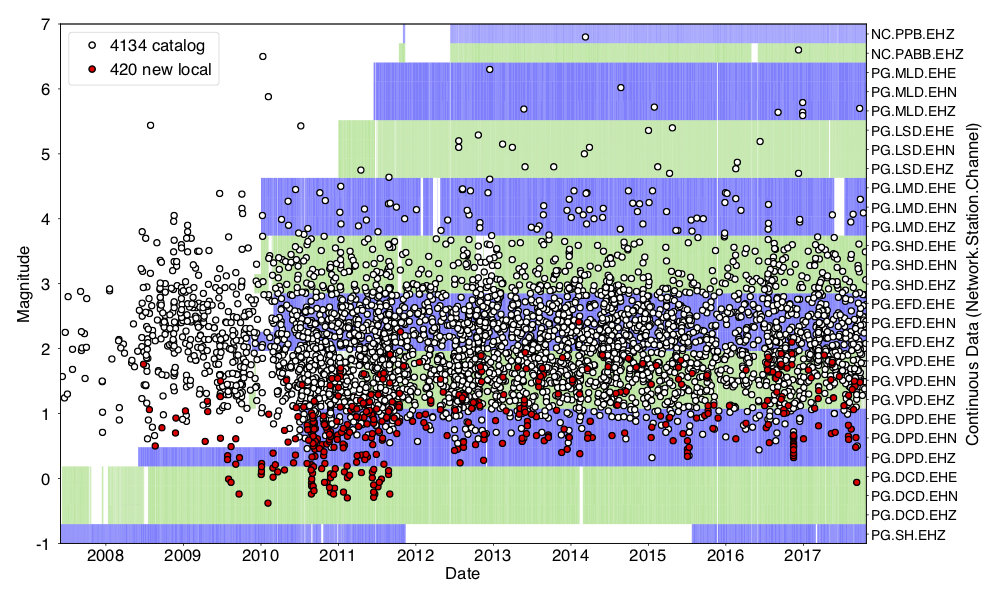
As an initial application, we detected similar earthquakes within 10 years of continuous seismic data (2007-2017) at an 11-station seismic network near the Diablo Canyon nuclear power plant in central California. Previous studies (Hardebeck, 2010; Hardebeck, 2013) have determined the presence of large faults near the power plant, so we looked for small uncataloged earthquakes that might reveal more information about possible earthquake sources in the area. We detected over 4,500 earthquakes at local and regional distances from the network. Although the rate and magnitude of seismicity near the power plant are relatively low, we found 224 small uncataloged nearby earthquakes (0 < M < 2) that can help discern active fault structures with further investigation.
 |
|---|
| FAST detected 4134 catalog earthquakes (white circles) and 420 new local earthquakes (red circles) from an unsupervised search for similar earthquake signals, within continuous seismic data (11 stations, 27 channels, duration shown with alternating blue-green bands) between June 2007 and October 2017. |
With ample computational resources (several Linux clusters with TB of memory and disk space), large-T similarity search for earthquake detection is now a reality, and can be applied to any seismic network. In addition to data sets described on this webpage, FAST has been tested on and successfully detected earthquakes in seismic data sets from Saudi Arabia, Italy, New Zealand, Netherlands, and Tanzania. The open-source FAST software, written in Python/C++ and tested on large Linux clusters, is available for public use at https://github.com/stanford-futuredata/FAST.
This project was part of the "Mining Seismic Wavefields" initiative at the Southern California Earthquake Center (SCEC).
Publications:
- Yoon, C. E., K. J. Bergen, K. Rong, H. Elezabi, W. L. Ellsworth, G. C. Beroza, P. Bailis, P. Levis (2019). Unsupervised Large-Scale Search for Similar Earthquake Signals, Bulletin of the Seismological Society of America, 109, 4, 1451-1468, https://doi.org/10.1785/0120190006. [Download PDF] [Download Supplementary ZIP]
- Rong, K., C. E. Yoon, K. J. Bergen, H. Elezabi, P. Bailis, P. Levis, and G. C. Beroza (2018). Locality- Sensitive Hashing for Earthquake Detection: A Case Study Scaling Data-Driven Science, Proceedings of the VLDB Endowment, 11, 1674-1687, https://doi.org/10.14778/3236187.3236214 (conference paper). [Download PDF] [Blog post by K. Rong]
Presentations (Oral):
- Yoon, C. E., G. C. Beroza, K. J. Bergen, K. Rong, H. Elezabi, P. Bailis, and P. Levis. A FAST Data- Mining Approach for Similar Earthquake Detection, 2018 SSA Meeting, Miami, Florida. (invited talk)
- Big data analytics for finding small earthquakes, UC Santa Cruz IGPP Seminar, January 2018. (invited talk)
- Yoon, C., K. Bergen, K. Rong, H. Elezabi, P. Bailis, P. Levis, and G. Beroza. Efficient blind search for similar-waveform earthquakes in years of continuous seismic data, 2017 AGU Meeting, New Orleans, Louisiana, Abstract S21E-01. (invited talk)
Presentations (Poster):
- Bergen, K. J., C. E. Yoon, K. Rong, P. Bailis, and G. C. Beroza. FAST: a data mining approach to large-scale earthquake detection, 2018 AGU Meeting, Abstract S11E-0416.
- Yoon, C. E., K. Bergen, K. Rong, H. Elezabi, P. Bailis, P. Levis, W. L. Ellsworth, and G. C. Beroza, Efficient blind search for small similar-waveform earthquakes in a decade of continuous seismic data (2007-2017) in coastal central California, 2017 SCEC Meeting, Abstract 024, https://www.scec.org/publication/7749.
Induced seismicity in Guy-Greenbrier, Arkansas
Collaborators:
-
Yihe Huang (University of Michigan, Earth and Environmental Sciences)
-
Greg Beroza, Bill Ellsworth (Stanford University, Geophysics)
In the last 10 years, the central and eastern United States has experienced a dramatic increase in earthquake activity, including a M 4.7 earthquake near Guy-Greenbrier, Arkansas in 2011 that happened after several months of intense seismic activity. Previous studies (Horton, 2012; Ogwari et al., 2016) have suggested that this earthquake sequence was induced by deep disposal of wastewater from oil and gas operations near a previously unknown fault.
We analyzed how this earthquake sequence initiated in order to determine whether and how these earthquakes were induced. We used precise earthquake detection (template matching and FAST), location, and correlation methods to maximize the amount of seismological information extracted from a sparse 3-station seismic network, and compared seismic activity with well data from the public Arkansas Oil and Gas database.
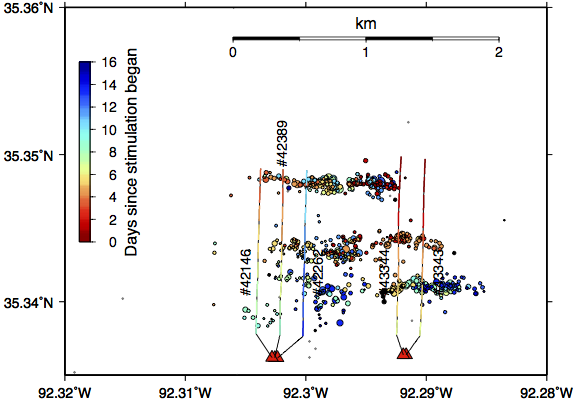
Most earthquakes during the initial 3 months of the Guy-Greenbrier earthquake sequence were induced by hydraulic fracturing stimulation (-1.5 < ML < 2.9), with many of them larger than expected (ML > 1). This suggests that earthquakes induced by hydraulic fracturing, as opposed to wastewater disposal, are more common than widely accepted, but they may not always be detected due to the lack of nearby seismic data. We also found a smaller number of microearthquakes (ML < 1) induced by wastewater disposal starting in July 2010.
 |
|---|
| Cluster of earthquakes spatially and temporally correlated with individual stages of hydraulic fracturing stimulation near Guy, Arkansas. Earthquakes (sized by magnitude) and stimulation stages along the production well (labeled by permit number) are both colored by time. See time-lapse movie of earthquakes and fracking stages here. |
We can separate seismicity induced by hydraulic fracturing from seismicity induced by wastewater injection using sensitive, precise seismological techniques, even with a sparse seismic network. This is important because oil and gas industry operators and regulators may make different decisions to reduce seismic risk depending on whether seismicity is induced by hydraulic fracturing or by wastewater injection.
This project was part of the Stanford Center for Induced and Triggered Seismicity (SCITS) industrial affiliates program.
Publications:
- Yoon, C. E., Y. Huang, W. L. Ellsworth, and G. C. Beroza (2017). Seismicity During the Initial Stages of the Guy-Greenbrier, Arkansas, Earthquake Sequence, Journal of Geophysical Research - Solid Earth, 122, https://doi.org/10.1002/2017JB014946. [Download PDF] [Download Supplementary PDF]
Presentations (Oral):
- Yoon, C., Y. Huang, W. Ellsworth, and G. Beroza, Microearthquakes Induced by Hydraulic Fracturing and Wastewater Injection in Guy-Greenbrier, Arkansas, Stanford Center for Induced and Triggered Seismicity Affiliates Meeting, May 2017.
- Yoon, C., Y. Huang, W. Ellsworth, and G. Beroza, New Evidence for Earthquakes Induced by Hydraulic Fracturing and Wastewater Injection in Guy-Greenbrier, Arkansas, Stanford Center for Induced and Triggered Seismicity Affiliates Meeting, October 2016.
- Yoon, C., Y. Huang, W. Ellsworth, and G. Beroza, The initial stages of the Guy-Greenbrier sequence using FAST earthquake detection, Stanford Center for Induced and Triggered Seismicity Affiliates Meeting, May 2016.
Presentations (Poster):
- Beroza, G. C., Y. Huang, W. L. Ellsworth, and C. E. Yoon, Seismicity During the First Three Months of the Guy-Greenbrier, Arkansas, Earthquake Sequence, SEG/SPE Workshop on Injection-Induced Seismicity, Dallas, Texas, November 2017. [Download PDF]
- Yoon, C. E., Y. Huang, W. L. Ellsworth, and G. C. Beroza. The Initial Stages of the Guy-Greenbrier, Arkansas, Earthquake Sequence: Induced by Both Wastewater Injection and Hydraulic Fracturing Amid Natural Seismicity, 2016 AGU Meeting, Abstract S43C-2883.
- Yoon, C. E., Y. Huang, W. L. Ellsworth, and G. C. Beroza, Earthquakes Induced by Hydraulic Fracturing and Wastewater Injection in Guy-Greenbrier, Arkansas, 2016 SCEC Meeting, Abstract 194.
- Yoon, C. E., O. O'Reilly, K. Bergen, Y. Huang, and G. C. Beroza, Searching for Unknown Earthquakes in the Guy-Greenbrier, Arkansas, Earthquake Sequence using Efficient Waveform Similarity Search, 2015 AGU Meeting, Abstract S13B-2850.
Media Coverage
- Small earthquakes at fracking sites may be early indicators of bigger tremors to come, say Stanford scientists (Stanford News)
- More Earthquakes May Be the Result of Fracking Than We Thought (AGU EOS)
- Shazam for Seismologists? How a new data mining technique is shaking up earthquake science (Yale Scientific Magazine)
Foreshocks and mainshock nucleation of the 1999 Mw 7.1 Hector Mine earthquake
Collaborators:
-
Nana Yoshimitsu (The University of Tokyo, Earthquake Research Institute)
-
Greg Beroza, Bill Ellsworth (Stanford University, Geophysics)
Foreshocks are smaller earthquakes that happen near, but before, a large earthquake. We can use foreshocks as a tool to help understand how large earthquakes begin, and to test end-member models of foreshock generation and earthquake initiation (Dodge et al., 1996; Beroza and Ellsworth, 1996; Mignan, 2014). At one extreme, the "cascade model" holds that small foreshocks directly trigger other small foreshocks by changing the stress on the fault and, eventually, a large earthquake occurs if the conditions are favorable. Since earthquakes of all sizes would start out the same way, it is impossible to predict ahead of time which earthquakes grow large. An alternative explanation, called the "preslip model", holds that smaller foreshocks do not directly trigger the large earthquake but instead are a symptom of something else happening underground, such as slow fault movement that does not release seismic waves. In this case, the foreshock area may indicate extent of the aseismic slip and predict the eventual mainshock size.
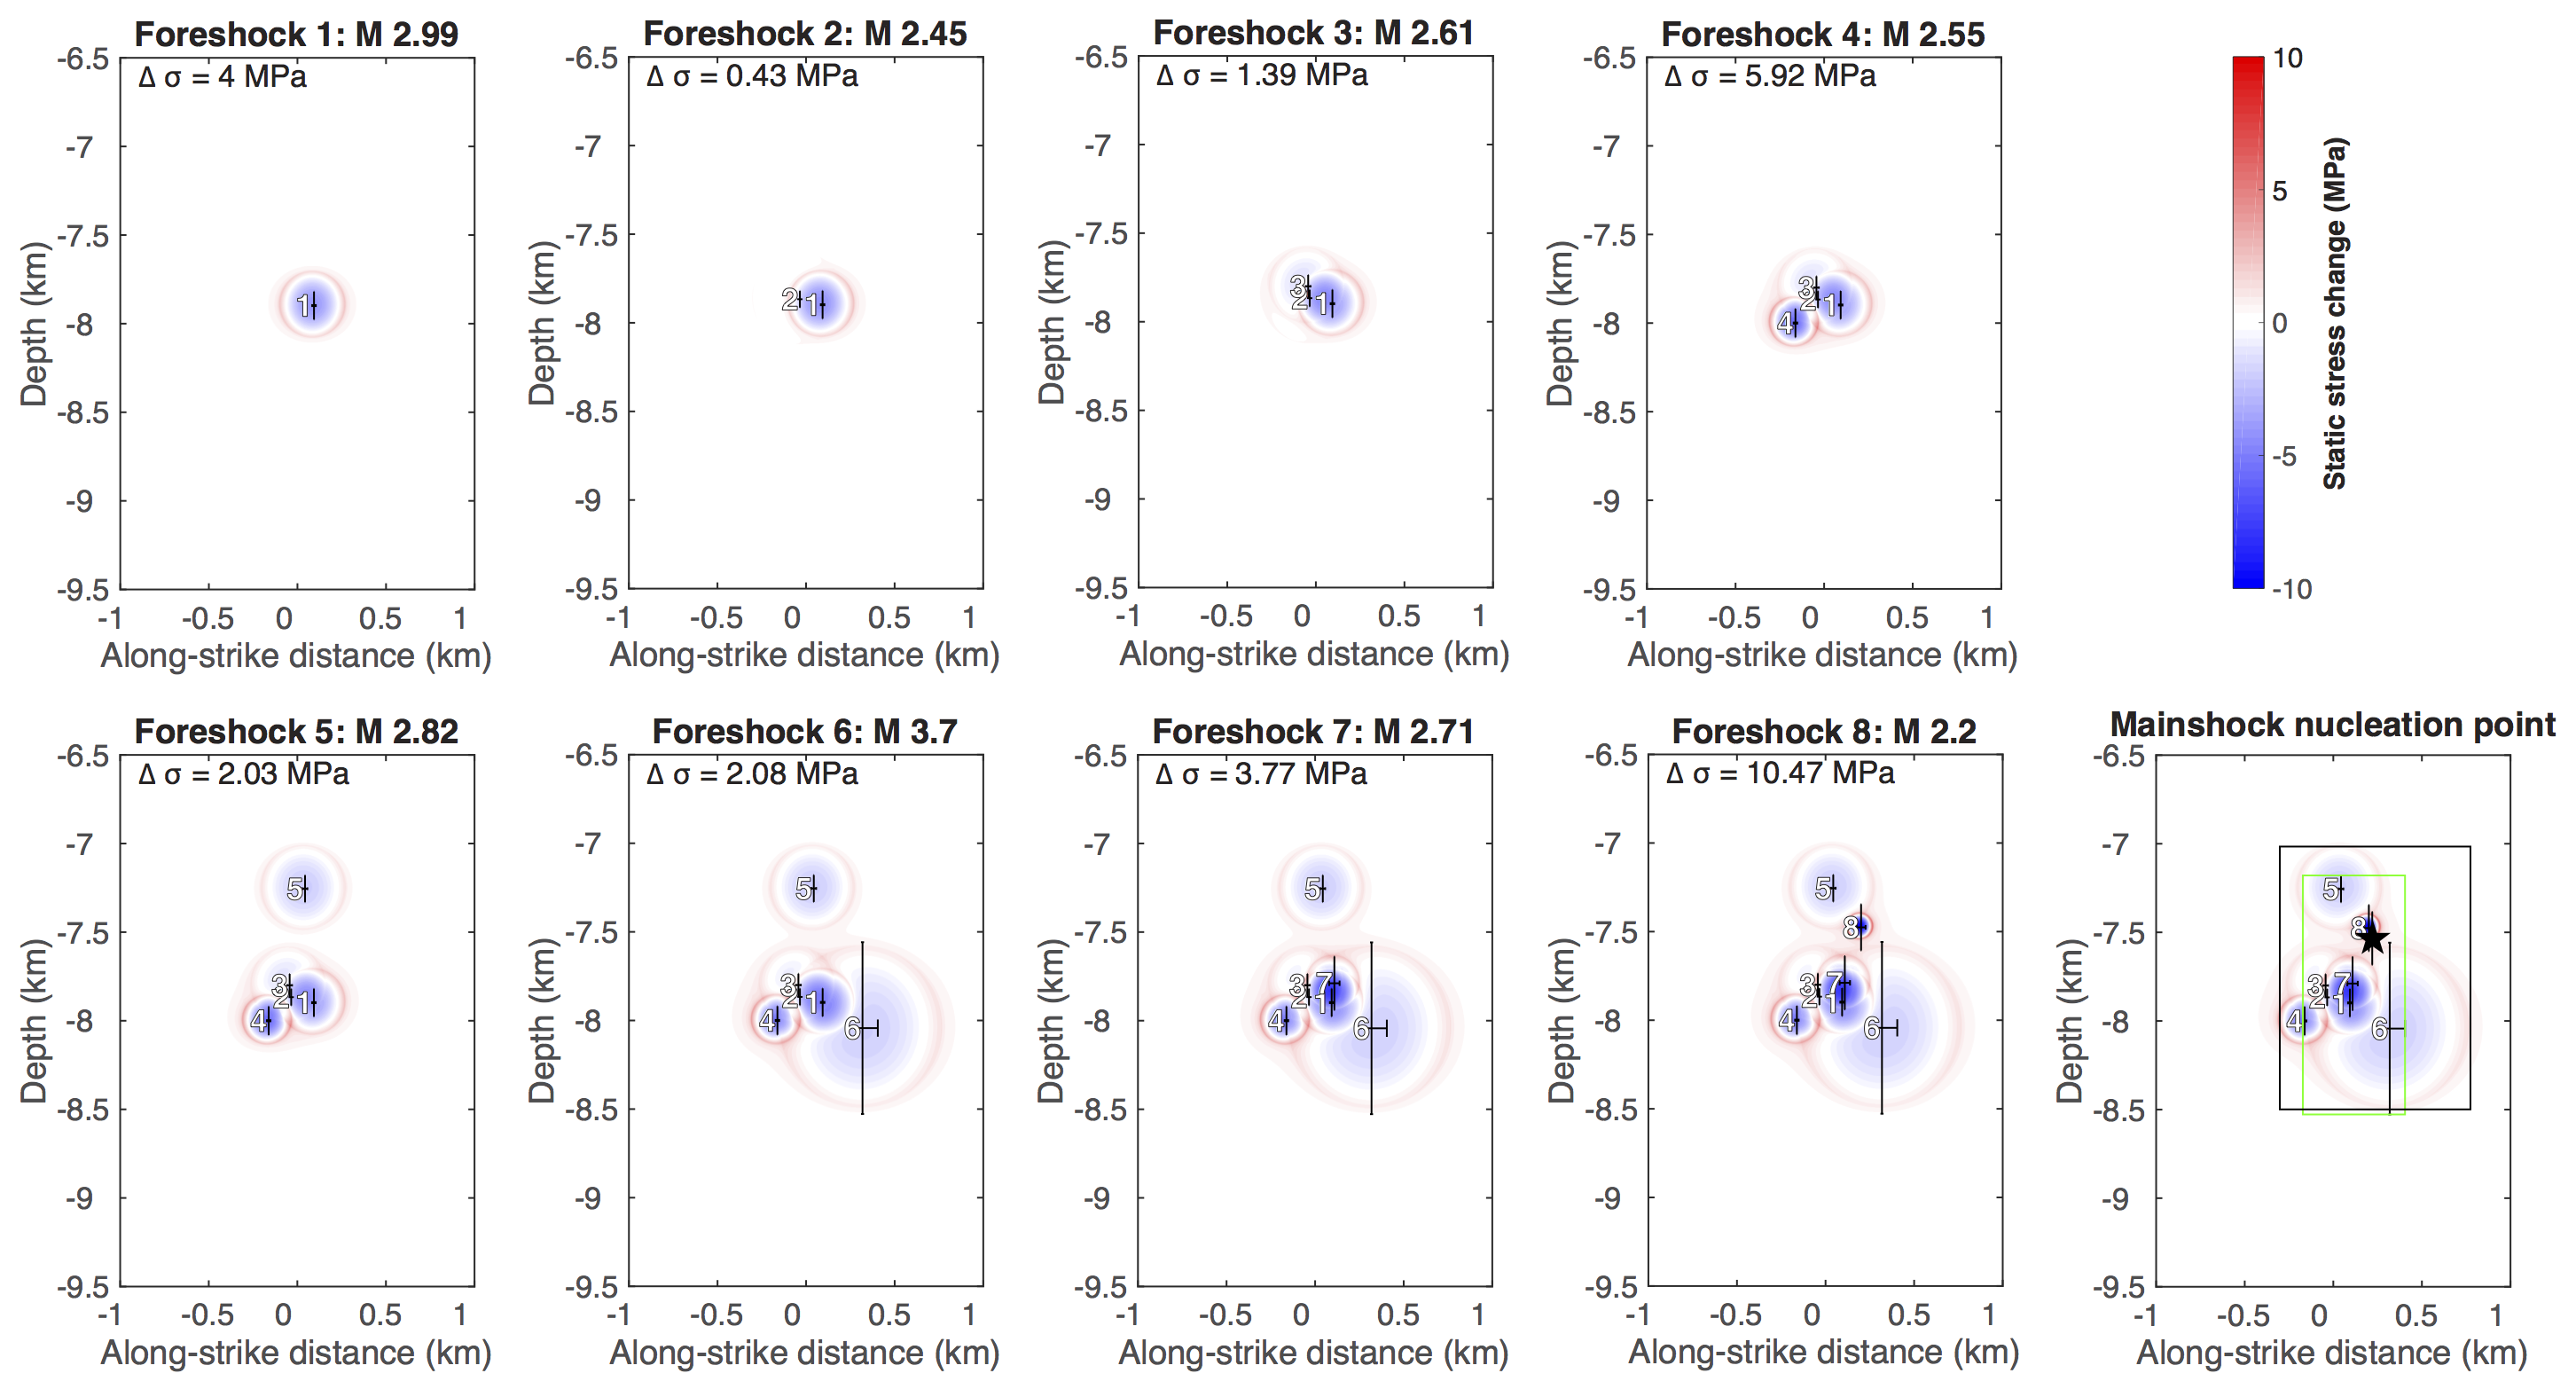
The 1999 Mw 7.1 Hector Mine earthquake, which occurred on a right-lateral strike-slip fault in the Eastern California Shear Zone, was preceded by a foreshock sequence that started 20 hours before the mainshock. We used methods that exploit similar waveforms from pairs of nearby foreshocks for precise seismological analysis. We first applied FAST to systematically detect as many foreshocks as possible. Then we used the double-difference location algorithm (Waldhauser and Ellsworth, 2000) to calculate precise relative location of the largest foreshocks and the mainshock. We calculated source parameters for the 8 largest foreshocks with the spectral ratio method (Imanishi and Ellsworth, 2006). With a circular fault rupture model, we estimated dimensions, slip, and stress drop for these foreshocks, then examined their space-time evolution and stress changes along the fault.
 |
|---|
| Static stress change on fault plane from 8 largest foreshocks in time order. Blue indicates areas of stress decrease inside the foreshock rupture, while red shows areas of stress increase immediately outside the foreshock rupture edges. The mainshock (black star) started at a location where the foreshocks had locally increased the stress. |
We observe that the foreshocks ruptured adjacent non-overlapping areas along the fault, and the Mw 7.1 mainshock started where the foreshocks had locally increased the stress. The simplest interpretation is that the Hector Mine foreshocks and mainshock triggered each other through a cascade of stress transfer, like falling dominoes. There is no need to invoke fault creep, aseismic slip, or fluid pressure as driving mechanisms for the foreshocks. But the question of why the mainshock rupture grew large, instead of stopping early like its foreshocks, still remains.
Future advances in understanding foreshocks and the earthquake nucleation process would require the ability to image foreshock sequences in greater detail, including precise locations, mechanisms, and nonplanar finite fault models. Dense seismic networks with near-field recordings of the foreshocks and mainshock, and quantitative near-field geodetic constraints on aseismic slip with strainmeters, would be examples of higher-resolution observational needs.
Publications:
- Yoon, C. E., N. Yoshimitsu, W. L. Ellsworth, and G. C. Beroza (2019). Foreshocks and Mainshock Nucleation of the 1999 Mw 7.1 Hector Mine, California, Earthquake, Journal of Geophysical Research – Solid Earth, 124, 1569-1582, https://doi.org/10.1029/2018JB016383. [Download PDF] [Download Supplementary PDF]
Presentations (Oral):
- Yoon, C., N. Yoshimitsu, W. Ellsworth, and G. Beroza, Another Look at the Foreshocks of the 1999 Mw 7.1 Hector Mine, California, Earthquake, SSA Annual Meeting, April 2017.
Presentations (Poster):
- Yoon, C., N. Yoshimitsu, W. Ellsworth, and G. Beroza, Foreshocks and Mainshock Nucleation of the 1999 Mw 7.1 Hector Mine, California, Earthquake, 2019 AGU Meeting, Abstract S21F-0580. [Download PDF]
- Yoon, C., N. Yoshimitsu, W. Ellsworth, and G. Beroza, How did the 1999 Mw 7.1 Hector Mine, California, earthquake begin? Insights from foreshocks, 2nd school on earthquakes: nucleation, triggering, rupture, and relationship with aseismic processes, Cargese, Corsica, October 2017.
Foreshocks and aftershocks of the 2012 Mw 7.4 Ometepec, Mexico earthquake
Collaborators:
The 2012 Mw 7.4 Ometepec earthquake happened along the subduction zone in Oaxaca, Mexico. A slow slip event may have triggered the mainshock (Graham et al., 2014), and the mainshock also triggered further aseismic slip (Dominguez et al., 2016). This earthquake also had an unusually active aftershock sequence (UNAM Seismology Group, 2013).
We used repeating earthquakes from before and after the mainshock as a deep aseismic slip gauge to measure changes in the slip rate. My contribution to this project was to use the FAST algorithm to search for previously unknown repeating earthquakes in the three months leading up to the Ometepec earthquake, and also find its undetected aftershocks, in continuous seismic data.
Presentations:
- Dominguez, L. A., T. Taira, W. Frank, C. Yoon, M. A. Santoyo, D. Legrand, and A. Iglesias, Detection of missing foreshocks and afterslip estimates of the 2012 Mw 7.4 Ometepec earthquake, Hazard Assessment of Large Earthquakes and Tsunamis in the Mexican Pacific Coast, SATREPS workshop, July 2017.
- Dominguez, L. A., T. Taira, W. Frank, C. Yoon, M. A. Santoyo, D. Legrand, and A. Iglesias, Investigation of the foreshock and aftershock sequence of the 2012 Mw 7.4 Ometepec earthquake using fingerprint and matched filter techniques, JpGU-AGU Joint Meeting, May 2017.
2008 Wenchuan earthquake aftershock detection competition
Collaborators:
Mostafa Mousavi, Yixiao Sheng, Weiqiang Zhu (Stanford University, Geophysics)
Alibaba Cloud and the China Earthquake Administration sponsored a "SeismOlympics" programming competition to detect aftershocks of the deadly 2008 Mw 7.9 Wenchuan earthquake, similar to the Netflix Prize or the Kaggle data science competitions. Competitors from seismology, machine learning, signal processing, computer science, and other backgrounds developed algorithms that automatically detect and pick phases on aftershock waveforms while avoiding false positive detections. Performance was evaluated against phases picked by human analysts. This was a great opportunity to test how the FAST earthquake detection algorithm measures up against other methods. Other members of my team used machine learning to pick phases and recognize false detections. We finished in 27th place in the first round of competition, and 16th place in the second round.
Oklahoma InSAR time series analysis: no surface deformation from deep wastewater disposal
Collaborators:
- Sang-Ho Yun (NASA-JPL)
- Howard Zebker (Stanford University, Geophysics)
Earthquake activity has dramatically increased in the central and eastern United States in the last 10 years, especially in Oklahoma, where earthquakes above magnitude 4 are now commonplace. Many scientific studies show that these larger earthquakes were likely induced by deep injection of large volumes of wastewater from oil and gas production over many years. We expect the surface of the earth to deform in response to injecting enormous amounts of fluid, but can we measure the amount of deformation from satellites in space?
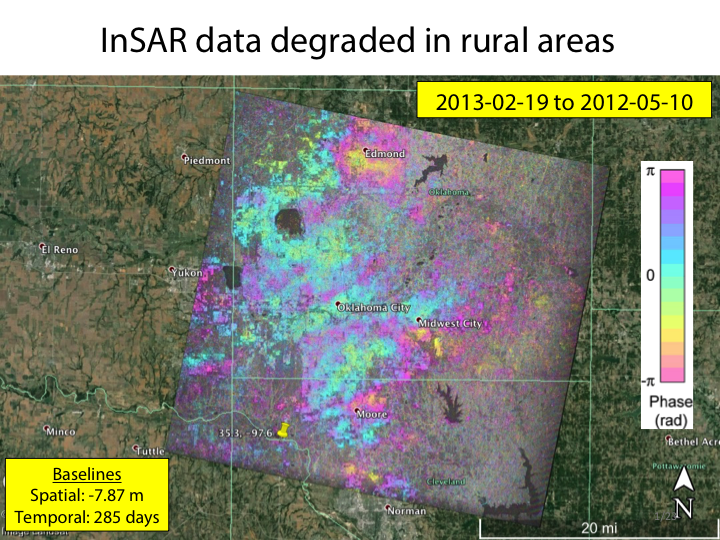
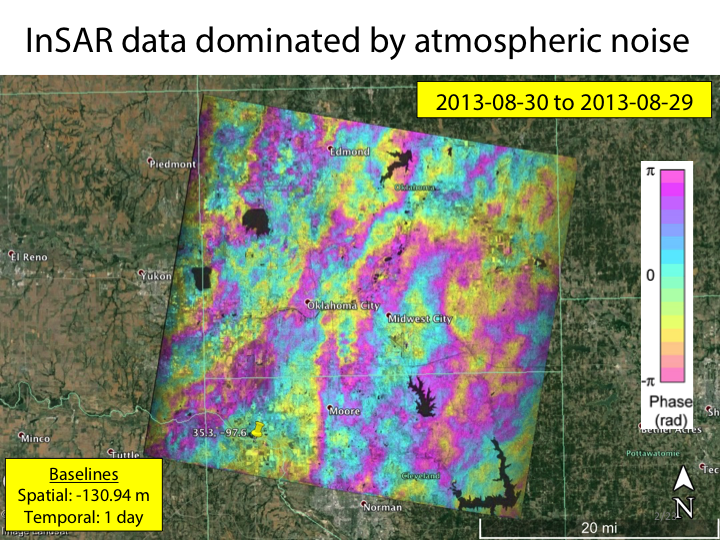
We applied interferometric synthetic aperture radar (InSAR) time series analysis on a high-quality data set in central Oklahoma, collected between 2011 and 2014 by the COSMO-SkyMed satellite, with 209 radar images and 1,955 interferograms (phase differences between two radar images collected at different times). The radar coverage area includes many earthquakes and injection wells.
  |
|---|
| It was challenging to work with this data set, with many sources of noise that obscured any signals from movement of the earth’s crust. (Top: temporal decorrelation in rural areas, Bottom: delays of the radar signal as it travels through the atmosphere) |
We found negligible large-scale surface deformation from wastewater injection near Oklahoma City between 2011 and 2014, estimating an upper bound of 2 mm/yr given the noise level in our InSAR data set. Some order-of-magnitude calculations, given the depth and storage coefficient of the Arbuckle formation into which most fluid is injected, confirmed that expected deformation would be about the same or less than the smallest signal we could detect with our InSAR data.
This project was part of the Stanford Center for Induced and Triggered Seismicity (SCITS) industrial affiliates program.
Presentations:
- Yoon, C., and H. Zebker, InSAR Time Series Analysis Reveals the Absence of Injection-Induced Surface Deformation in Central Oklahoma, Stanford Center for Induced and Triggered Seismicity Affiliates Meeting, October 2016.
- Yoon, C., and H. Zebker, InSAR Observations of Injection-Related Deformation, Stanford Center for Induced and Triggered Seismicity Affiliates Meeting, February 2015.
2019 Ridgecrest, California Mw 6.4 and Mw 7.1 earthquake response
Collaborators:
- Many people in the USGS, Caltech Seismo Lab, and especially the Southern California Seismic Network (SCSN)
A seismically quiet period in southern California ended abruptly with a Mw 6.4 earthquake near Ridgecrest, California, on July 4, 2019 around 10:30 am local time, which was followed by aftershocks in a perpendicular L-shape. Almost 34 hours later, that same area hosted a Mw 7.1 earthquake at 8:20 pm local time, which ruptured to the northwest and southeast along a previously unknown fault, then followed by a vigorous aftershock sequence. This Ridgecrest earthquake sequence was the first major earthquake to be felt in southern California since the 2010 Mw 7.2 El-Mayor Cucapah earthquake, and to occur in southern California since the 1999 Mw 7.1 Hector Mine earthquake.
I was a first-time duty seismologist for the SCSN at the time of the Ridgecrest earthquakes, which meant that I was on-call 24/7 during the coming week to respond to any earthquake above a magnitude 3.5 in southern California, alerted by a beeping pager. The duty seismologist immediately reviews the earthquake waveform data to ensure the accuracy of its automated location and magnitude information that is provided to the public, and coordinate with external partner agencies and media specialists.
On Thursday, July 4, 2019 around 10:30 am, I felt a light shaking at home in Pasadena, which I might have mistaken for a truck passing by, except that my pager started blaring and registered a "M 6.4". I quickly went on my computer to verify the earthquake waveform data with my own eyes, and it looked legitimate. I noted the location of the earthquake near Ridgecrest. I started to complete the steps on our duty checklist, which involved making phone calls to partner agencies including the USGS National Earthquake Information Center (NEIC) in Colorado; Caltech Media Center; California Geological Survey (CGS); California Office of Emergency Services (Cal OES). When I arrived in the office about 45 minutes later, some of my colleagues were already busy at work, although many people were out of town for the holiday. The street outside the office was packed with vans from TV and news stations. The Media Center conference room in the Caltech Seismo Lab was filled with reporters from various southern California news media sources, and I watched Lucy Jones inform and reassure the southern California populace during a news briefing. She explained that there is a 1 in 20 chance that there may be a larger earthquake following the Mw 6.4, but the more likely scenario was the 19 in 20 chance that only smaller aftershocks would follow.
 |
|---|
| Waveform data for the Mw 6.4 earthquake on July 4, 2019, showing ground shaking levels, and P, S phase arrival picks, with increasing distance from the earthquake location. I reviewed hundreds of plots like these for M > 3 aftershocks of the Ridgecrest earthquakes. |
I worked a full day on Friday, July 5, 2019, spending most of the time digesting as much of the information available about the Mw 6.4 earthquake yesterday as possible. At 8:20 pm, I was sitting at home when I started to feel some shaking, which was much stronger than the shaking yesterday (but not bad enough that I had to get under a table), and it lasted for at least 10 seconds. Assuming that it was also located near Ridgecrest, I knew right away it was bigger than a 6.4. The SCSN real-time earthquake monitoring software ingests ground shaking measurements from sensors at 600 distributed stations located all over southern California, automatically detects the earthquake, calculates its location and magnitude, and sends that information to various endpoints within a couple minutes, including my pager which beeped with a "M 7.1" magnitude and a location near Ridgecrest. That 1 in 20 chance of a larger earthquake had come true; the Mw 6.4 yesterday was re-branded as a foreshock.
Once again, I inspected the earthquake waveform data, and verified that the location and magnitude were correct. Although the USGS earthquake website went down briefly due to the spike in activity, our local SCSN and Data Center websites, as well as the Earthquake Notification Service (ENS), functioned properly and provided reliable earthquake information to the public. After completing the duty checklist again and calling all the partner agencies, I arrived in the office 30 minutes later. Many of my colleagues were already there, and the media center conference room was completely packed. There was another news media briefing about the Mw 7.1 "Searles Valley" earthquake (which was later renamed "Ridgecrest" after the fact). The big screens showed the real-time aftershock locations outlining a large northwest-southeast oriented fault, and at one point the ShakeAlert earthquake early warning system was demonstrated live before an aftershock. The reporters asked many questions about the faults, the number of aftershocks above a certain magnitude that have happened, the number and magnitude of aftershocks to expect in the future, and how these earthquakes affect the risk of a "Big One" on the San Andreas Fault. The pager was beeping every few minutes, every time there was an aftershock above a magnitude 3.5; the elevated activity of an aftershock sequence really hit home, as I had to visually inspect waveforms for each of these aftershocks. I did not leave the office until after midnight.
I went into work on Saturday, July 6, 2019. The Caltech Media Center was open again, and many reporters wanted updated information about the earthquakes. I did a one-on-one interview with Fox 11 News to talk about earthquake monitoring in southern California. I provided periodic updates of the number of aftershocks with M > 5, M > 4, M > 3, and total number of aftershocks, to the California Office of Emergency Services. I answered questions about our earthquake data from the California Geological Survey.
On Monday, July 8, 2019 (a regular workday), I conducted a few more interviews with news media. Since we had some issues with our automatic ShakeMap (real-time ground shaking intensity map) systems for the Mw 6.4 and Mw 7.1 earthquakes, I wrote a summary report about it for our management and external stakeholders, and recommended improvements in our coordination procedure.
Responding to the Ridgecrest earthquakes was a memorable and rewarding experience. The demand for an earthquake seismologist is highest in the aftermath of a major earthquake, and I saw firsthand that one of the most important things a seismologist can do is to provide the public with reliable, accurate information about an earthquake. The SCSN automatic earthquake monitoring system performed very well during this demanding earthquake sequence. The wealth and quality of scientific data (seismic, GPS, satellite, geologic mapping) collected for these Ridgecrest earthquakes will contribute greatly to our scientific understanding of the earthquake process.
Publications:
- Hauksson, E., C. Yoon, E. Yu, J. R. Andrews, M. Alvarez, R. Bhadha, and V. Thomas (2020). Caltech/USGS Southern California Seismic Network (SCSN) and Southern California Earthquake Data Center (SCEDC): Data Availability for the 2019 Ridgecrest Sequence, Seismological Research Letters, https://doi.org/10.1785/0220190290. [Download PDF]
Media Response:
- Big One Still Looms (Victor Valley Daily Press, July 15, 2019)
- The Big One is likely overdue in the Coachella Valley, where major earthquake faults connect (The Desert Sun, July 8, 2019)
- Various interviews on July 6-9, 2019: TV (Fox 11 Los Angeles), video (Voice of America), radio (100.7 San Diego)
Summary of geophysics skills
- I am well versed in many aspects of observational earthquake seismology, especially understanding seismicity. Given raw seismogram data, I can detect, locate, and characterize earthquakes with a variety of methods and software packages.
- Earthquake detection: FAST, STA/LTA, template matching, phase picking (automatic and manual)
- Earthquake location: VELEST, HYPOINVERSE, HYPODD (including cross-correlation differential times)
- Earthquake magnitude: Moment magnitude (from displacement, in time and frequency domains), local magnitude (absolute with Wood-Anderson response, and relative)
- Seismic and earthquake data processing: ObsPy, Seismic Analysis Code (SAC), Python, MATLAB, bash shell script, signal processing and filtering, earthquake catalog data analysis
- I can take advantage of computational resources to extract earthquake information from large seismic data sets (GB to TB volumes), while understanding tradeoffs between runtime, memory, and disk space.
- I am familiar with the use of radar, synthetic aperture radar (SAR), and interferometric synthetic aperture radar (InSAR) as a geophysical tool, including applications for monitoring surface deformation and earthquake hazards.
- I first worked on radar and SAR data processing and simulation at Arete Associates, where I learned many techniques for signal and image processing.
- I spent some time with the Stanford Radar Remote Sensing Group where I learned how to process and interpret InSAR data, including the Small Baseline Subset (SBAS) time series inversion method. InSAR computes the phase difference between pairs of radar images, collected at different times, to detect mm-to-cm level displacements on large swaths of the earth surface.
- Although my thesis work is in earthquake seismology, InSAR is a fascinating technology for monitoring earthquake hazards. The accelerating growth of InSAR data volumes, given many recent new satellites with shorter revisit times, pose new challenges for extracting useful information and many opportunities for data-driven discovery.
- I also have a broader earthquake science background (geodesy, geology, tectonics, earth structure) from coursework and seminars, and am familiar with the scientific literature on earthquakes.
- Coursework: earthquake seismology, global seismology, Fourier transforms, inverse methods, tectonophysics, crustal deformation, structural geology and rock mechanics, computational earth science
- I can effectively communicate scientific concepts in oral and written form to a variety of collaborators and audiences.
- I am experienced in scientific visualization, conference poster and oral presentations, software documentation, and technical writing in peer-reviewed publications.
- Scientific visualization software: Matplotlib, Generic Mapping Tools (GMT), Google Earth Pro, Adobe Illustrator, Microsoft PowerPoint
- I have reviewed manuscripts submitted to peer-reviewed journals, Journal of Geophysical Research - Solid Earth and Seismological Research Letters, as well as proposals to the National Science Foundation - Earth Sciences.
- I have worked as a teaching assistant for graduate-level courses in seismology and radar remote sensing.
- I have talked to the news media about earthquake science, regarding press releases for my research publications, as well as responding to major earthquakes in southern California.
- I am experienced in scientific visualization, conference poster and oral presentations, software documentation, and technical writing in peer-reviewed publications.