Research
Brief Introduction to Optical Coherence Tomography
Initially, a simple way to understand OCT is to think of it as
the optical analog of ultrasound imaging. In ultrasound imaging,
an image of the scanned sample is generated by tracing out the
echo time sequence of the reflected ultrasound pulse. The deeper
a reflector is, the longer it takes for the echo to return.
In the case of OCT, the echoes arrive within a very short interval
of one another. For a depth of 1 mm, the time separation between
the top surface and the bottom is about 7 x 10-12s. For those
who are more comfortable in the frequency regime, this implies
a frequency of 1.5 x 10¹¹Hz. At this time interval or frequency,
it is not experimentally feasible to detect the echoes directly.
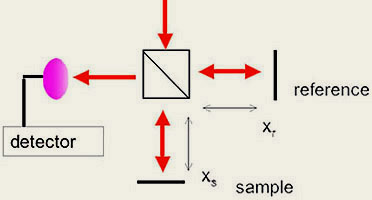
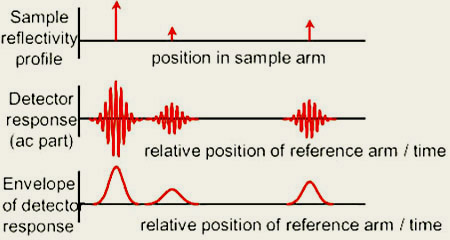
Fortunately, we can use interferometry to help us out. Consider
the above scheme and assume that the light beam comprises of a train
of light pulses. An input beam into a beamsplitter is split into
two beams. One is reflected from a reference mirror, while the other
is reflected from a sample. Next, consider a very simple sample consisting
of a single reflector. The two reflections are combined at the
beamsplitter. Now, if the distance to the reference mirror equals
the distance to the sample, then the light pulses will overlap in
time and interfere. Otherwise, they will not overlap in time
and will not interfere. So by scanning the reference mirror,
we can map out the location of the reflectors within the sample as
a function of depth.
The use of interferometry also gets us away from actually having
to use light pulses. In this case, a light source that has the
same frequency bandwidth as one based on light pulses will give
the same OCT imaging capability.
A deeper OCT interpretation. A better way to understand
OCT is by looking in the wavelength domain.
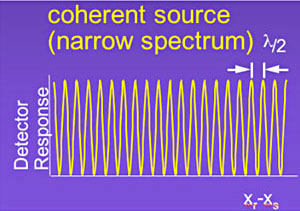
Consider the same scheme as above, but now assume a monochromatic light source.
If you scan the reference mirror, you will see a continuous sinusoidal
interference signal. The period of this signal, in (xr , xs)
dimension, is simply lambda/2.
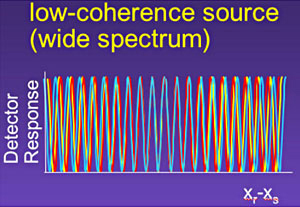
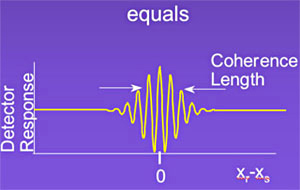
Now, if the light source has a spectral span, we can treat each
wavelength component in the same manner. The resulting signal
we see in the end is simply the sum of the individual traces.
Since each sinusoidal component will have a slightly different
wavelength, their periods will be slightly different as well. Upon summing,
we will get a resulting interference signal that drops off rapidly
beyond the point where the two reflectors are matched in pathlengths.
(Second level + 1) OCT interpretation.
Recently, several research groups came to realize that the above approach for doing OCT
imaging is not the most efficient. The above approach has been termed "time-domain OCT" in
view of the fact that a scan of the reference mirror in time
is required to generate the requisite information set.
A good starting point to begin understanding this inefficiency
is to think about the following question:
What if we don't detect just the sum of the wavelength
components, but instead, detect ALL of the
wavelength components individually?
Certainly, we will end up with more information. And in fact,
this set of information is N/2 times richer than that from time-domain
OCT, where N is the number of wavelength detection channel employed.
[Technical
Article]
It is actually possible to reconstruct the location of reflectors
within the sample using this set of information without resorting
to the scanning of the reference mirror.
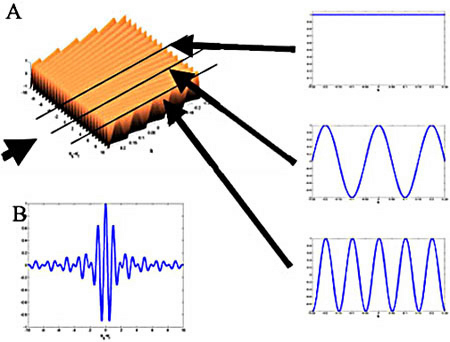
The above figure illustrates the additional dimension of information
available from acquiring spectrally differentiated data. Figure
A shows the relationship between the pathlength mismatch, wavelength,
and the interference signal. When we detect the total light intensity
with a single detector while scanning the reference mirror position,
we are simply summing up the signal in the wavelength dimension
and generating a summed signal with the correct coherence envelop
as shown in Figure B. If instead, we take a spectral trace at
a fixed reference mirror position, the period of the observed
sinusoidal oscillation can be used to work out the location reflection.
If there is more than one reflector in the sample, a Fourier
decomposition of the spectral trace will provide both their positions
(from the period) and their reflectivity (from the oscillation's
amplitude).
In view of this development, one focus of our laboratory is
to develop new OCT schemes that exploit this advantage to render
OCT images with improved acquistion efficiency.
|