Inflation and the Cosmic Microwave Background
Improved Constraints on Primordial Gravitational Waves using Planck, WMAP, and BICEP/Keck Observations through the 2018 Observing Season (Phys. Rev. Lett. 127, 151301, 2021)
 The Cosmic Microwave Background (CMB) is the oldest light in the universe.
For its first 380,000 years, the universe was a hot plasma of protons, electrons, and photons; as it expanded and cooled, the electrons and protons combined into neutral atoms and the photons streamed free.
We observe them today as a faint microwave glow covering the entire sky — a snapshot of the infant universe, carrying the imprint of the tiny density fluctuations that later grew into every galaxy we see.
The Cosmic Microwave Background (CMB) is the oldest light in the universe.
For its first 380,000 years, the universe was a hot plasma of protons, electrons, and photons; as it expanded and cooled, the electrons and protons combined into neutral atoms and the photons streamed free.
We observe them today as a faint microwave glow covering the entire sky — a snapshot of the infant universe, carrying the imprint of the tiny density fluctuations that later grew into every galaxy we see.
Those fluctuations are thought to originate as quantum fluctuations, stretched to cosmic scales during inflation — a burst of exponential expansion in the first fraction of a second. Inflation makes a further, testable prediction: it should also have produced a background of primordial gravitational waves, which would leave a distinctive curl pattern, called B-mode polarization, in the CMB. Density fluctuations alone produce only the gradient-like E-mode pattern. A detection of primordial B-modes would therefore be direct evidence for inflation, and a measurement of its energy scale.

 The BICEP/Keck program fields a series of small-aperture telescopes at the South Pole, where the dry, stable atmosphere provides the best millimeter-wave observing conditions on Earth.
By concentrating thousands of superconducting detectors on a small patch of sky at multiple frequencies, we have produced the deepest maps of CMB polarization at degree angular scales ever made.
I led the BICEP3 analysis in the BK18 result, which combines BICEP/Keck data through 2018 with Planck and WMAP to set the current best limit on primordial gravitational waves: a tensor-to-scalar ratio r < 0.036 at 95% confidence.
Every improvement in this measurement eliminates families of inflation models.
The next generation — BICEP Array, and eventually CMB-S4 — will push another order of magnitude deeper, into the range predicted by the simplest models of inflation.
The BICEP/Keck program fields a series of small-aperture telescopes at the South Pole, where the dry, stable atmosphere provides the best millimeter-wave observing conditions on Earth.
By concentrating thousands of superconducting detectors on a small patch of sky at multiple frequencies, we have produced the deepest maps of CMB polarization at degree angular scales ever made.
I led the BICEP3 analysis in the BK18 result, which combines BICEP/Keck data through 2018 with Planck and WMAP to set the current best limit on primordial gravitational waves: a tensor-to-scalar ratio r < 0.036 at 95% confidence.
Every improvement in this measurement eliminates families of inflation models.
The next generation — BICEP Array, and eventually CMB-S4 — will push another order of magnitude deeper, into the range predicted by the simplest models of inflation.
The BK18 likelihood results
Left: Multicomponent likelihood analysis of BICEP/Keck, WMAP, and Planck data. The faint red curves are the previous BK15 baseline; the bold black curves are BK18, which adds three seasons of BICEP3 data at 95 GHz and Keck Array data at 220 GHz. The upper limit on the tensor-to-scalar ratio tightens to r < 0.036 at 95% confidence. Ad and Async are the amplitudes of the dust and synchrotron B-mode foregrounds, with frequency and spatial spectral indices β and α, and dust–synchrotron correlation ε; dashed lines show the priors. Right: Constraints in the r versus ns plane for the Planck 2018 baseline analysis, and adding BICEP/Keck data through 2018 plus BAO. The constraint on r tightens from r < 0.11 to r < 0.035.


Science with SPHEREx
 SPHEREx — the Spectro-Photometer for the History of the Universe, Epoch of Reionization, and Ices Explorer — is a NASA Medium-Class Explorer launched in March 2025.
Using linear variable filters, it images the entire sky in 102 spectral channels from 0.75 to 5 microns, producing a low-resolution spectrum of every point on the sky every six months.
No previous survey has provided spectra of the whole sky at this depth.
As instrument calibration scientist, my job is to make sure the survey's precision matches its ambition.
SPHEREx — the Spectro-Photometer for the History of the Universe, Epoch of Reionization, and Ices Explorer — is a NASA Medium-Class Explorer launched in March 2025.
Using linear variable filters, it images the entire sky in 102 spectral channels from 0.75 to 5 microns, producing a low-resolution spectrum of every point on the sky every six months.
No previous survey has provided spectra of the whole sky at this depth.
As instrument calibration scientist, my job is to make sure the survey's precision matches its ambition.
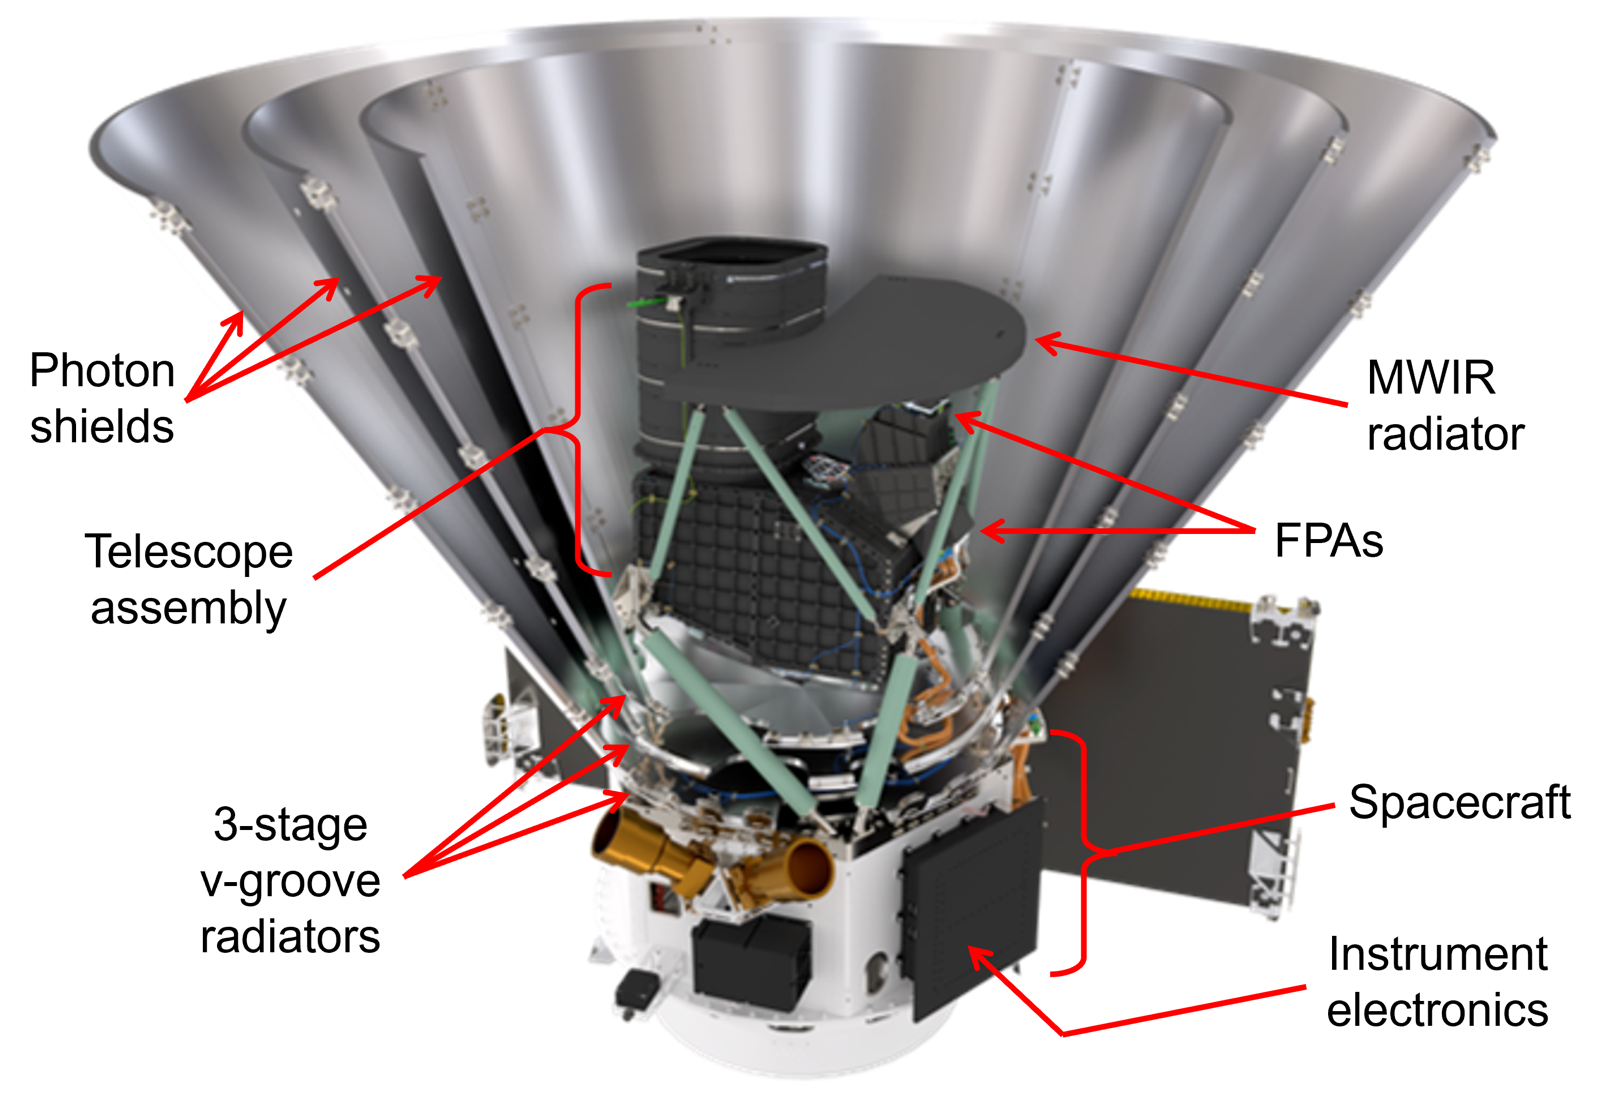
The SPHEREx observatory (from the mission paper, Bock et al. 2026, ApJ 999, 139).
Mapping the Large-Scale Structure of the Universe
SPHEREx measures redshifts for hundreds of millions of galaxies, mapping the three-dimensional structure of the universe across the full sky. The shape of galaxy clustering on the largest scales encodes primordial non-Gaussianity — subtle correlations in the initial conditions that discriminate between single-field and multi-field models of inflation. Where BICEP tests inflation through gravitational waves, SPHEREx tests it through the statistics of the density field: two independent windows on the same first instant.
The Collective Light of All Galaxies
By mapping fluctuations in the diffuse infrared background — the accumulated light of all stars and galaxies, including those too faint to detect individually — SPHEREx traces the total light production of the universe back to the epoch of reionization, when the first luminous objects ionized the intergalactic medium. This intensity-mapping approach measures whole populations statistically rather than object by object. It is the science that drives my own work on instrument systematics, because large-scale diffuse signals are exactly where uncorrected instrumental structure hides. It is also why I help organize the Line Intensity Mapping conference series.
Investigating the Abundance of Biogenic Ices
Closer to home, SPHEREx surveys water, carbon dioxide, methane, and methanol ices in molecular clouds and star-forming regions throughout the Milky Way — a census of the raw materials for planets and, potentially, for life.
Atmospheric Airglow
The brightest features in raw SPHEREx spectra are not astronomical — they are emission lines from Earth's upper atmosphere. We reported the first SPHEREx observations of atmospheric helium and oxygen airglow (accepted to JGR Atmospheres, 2026), mapping the He 10830 Å and O 8446/11287 Å lines over the Earth continuously as the survey scans the sky. The helium emission follows the winter hemisphere, migrating from south to north with the seasons, and responds to solar and geomagnetic activity. Beyond cleaning the astronomical data, these measurements are a new probe of the upper atmosphere, heliophysics, and aurora — a program I run with a team of graduate students and a postdoc.

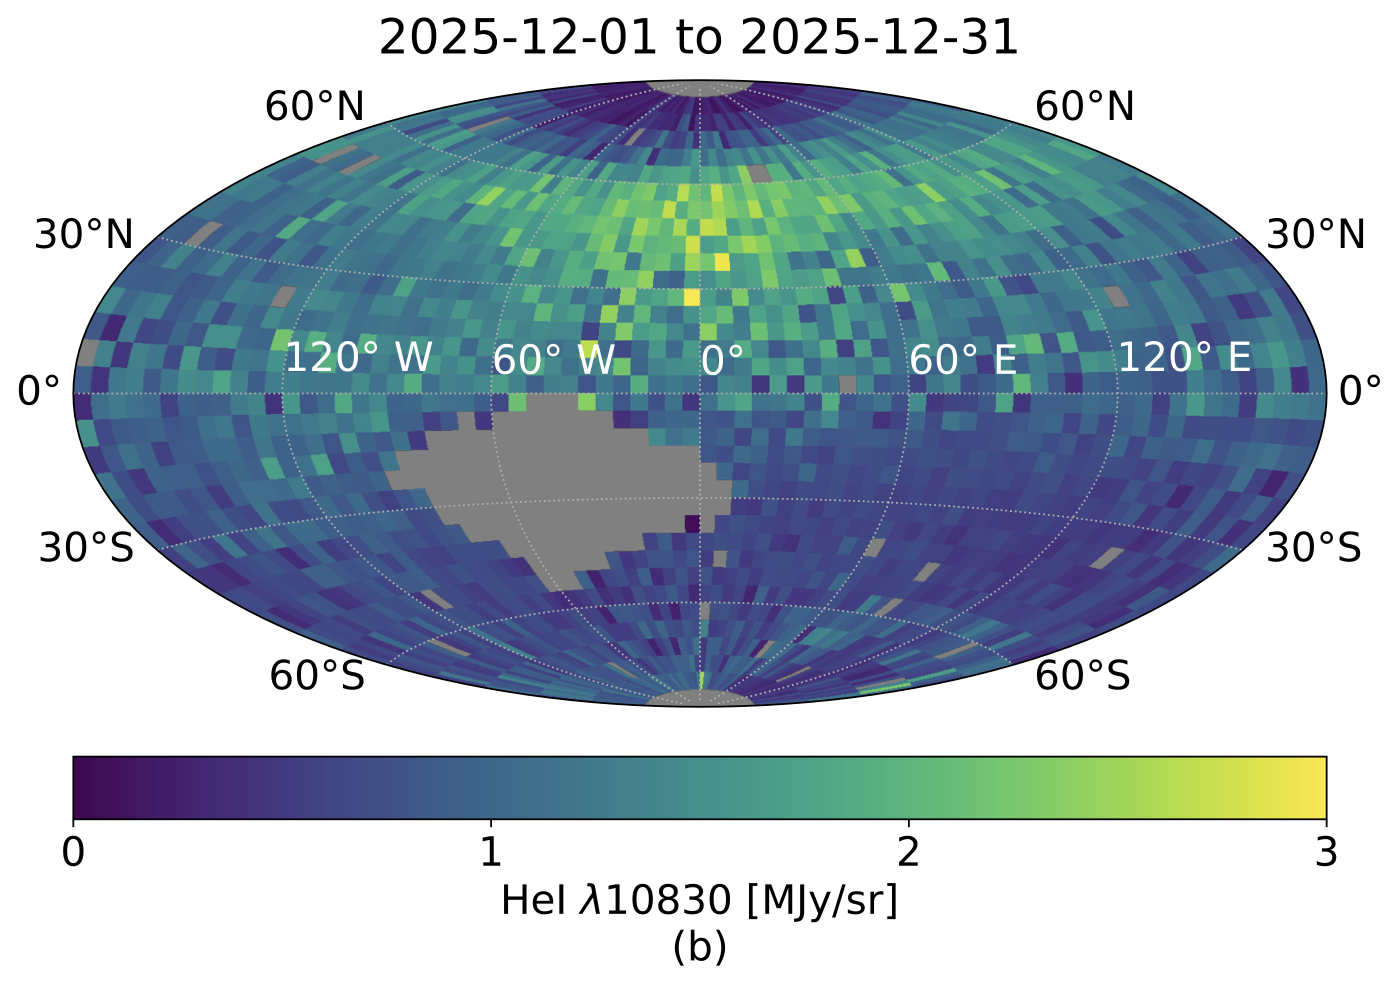
Monthly maps of He 10830 Å airglow over Earth from SPHEREx, May 2025 (left) and December 2025 (right): the emission follows the winter hemisphere (Hui et al. 2026, JGR Atmospheres).
Zodiacal Light
Sunlight scattered by interplanetary dust — the zodiacal light — is the dominant diffuse foreground over most of the sky in the near infrared. The models in use today are anchored to space data taken decades ago; SPHEREx measures the zodiacal sky in 102 channels, continuously, through the full year. I am leading the development of a new zodiacal light model built from the SPHEREx survey itself, both to open a path to absolute measurements of the extragalactic background light and to study the interplanetary dust cloud in its own right.