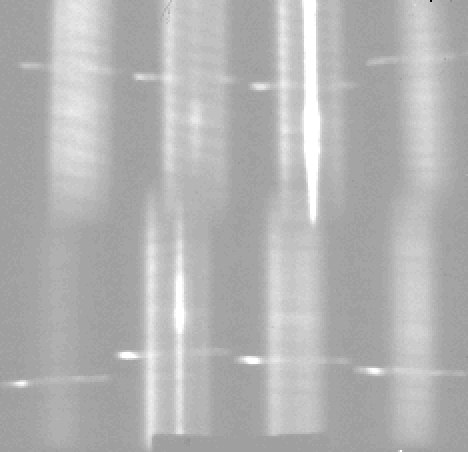
This is what a raw spectrum looks like. In this case, it's a five minute exposure of the planetary nebula called BD+30 (19:32:47.3, +30*24'17", 1950.0). In effect, there areeight adjacent slits, each which produce a spectrum. Wavelength (color) changes in the up-and-down direction (wavelength increasing away from the center), while the left-right direction in each of the slits represents position on the nebula. The eight pieces can be put back together to look like the pictures below. Note the central star only really shows up in two of the slits, which represent the central two slits in the stack of eight. Note also the horizontal line in each of the eight slits. This represents light in the nebula at one exact, discrete wavelength.
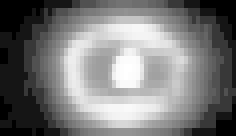
This continuum-light image is constructed from the raw frame at top, and includes only the light that's continuous (no discrete wavelength features). This is more-or-less what this object would look like to your eye. The field of view is 5.5"x9.5" across.
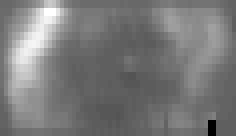
This image is a reconstruction of just the light that shows up in the raw image at a very discrete wavelength (horizontal lines in the raw image). This particular emission line is that of molecular hydrogen. Note in the raw frame that the peak intensity of this line is out to the sides of the continuum (vertical) swath. It is also clear by looking at this image that the bright parts are outside of the donut seen in the continuum image.
Example Data for an ultraluminous infrared galaxy