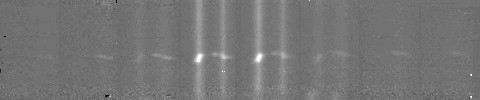
This is a PIFS spectrum of the ultraluminous infrared galaxy (ULIRG) IRAS 1019+13. This ULIRG, like many, has two galactic nuclei, and is in the process of merging. The picture above is actually eight simultaneous spectra of the galactic pair. Wavelength increases in the vertical direction. The eight spectra, placed side-by-side above, are ordered sequentially, such that the leftmost spectrum corresponds to one edge of the rectangular field, and the rightmost slit represents the other edge. The centered galaxy pair therefore appears strongest in the middle slits. Vertical stripes represent continuum emission from stars in the galaxies, while the odd looking squiggles midway up the stripes reveal the presence of Hydrogen gas. The particular line seen here is Paschen-alpha, with a rest wavelength of 1.875 microns. Note that the line emission is seen in all eight slits, while the continuum emission is only seen in about 4-5 slits.
These eight spectra can be put back together to form images at specific wavelengths and wavelength ranges, as is shown below.
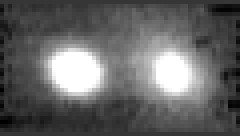
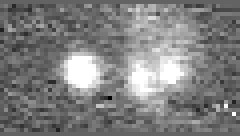
This continuum-light image of the double-nucleus ULIRG is constructed from the spectra at top, and includes only the light that's continuous (no discrete wavelength features). This is more-or-less what this object would look like to your eye. The field of view is 5.4"x9.6" across.
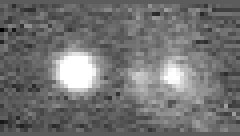
This image is a reconstruction of just the light that shows up in the top image at a very discrete wavelength (line emission). This particular emission line is one of atomic hydrogen. Note the extra lump of emission between the two nuclei, with no counterpart in the continuum image. Also visible is the very diffuse emission surrounding the right-hand nucleus.
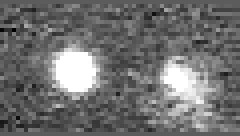
This is much like the above image, in that the light seen here is entirely composed of hydrogen gas emission. But the gas seen here is moving towards us at 175 km/s relative to the mean motion of the galaxy pair. In the top image, the fact that the emission lines (squiggles) curve around (they're not straight and level) indicates that the gas responsible for the emission of light is moving toward or away from us. This induces a wavelength shift (Doppler effect), which is seen as a vertical shift in the spectrum, as seen in the top image. The gas in this image is on the "blue" end of the line emission feature (the low side of the squiggles).
And this is the gas that is moving away from us (also centered at 175 km/s). Therefore this emission comes from the red (high) end of the spectral features seen in the top frame. Note the difference in appearance between the last two images. For instance, the lump between the two nuclei only shows up in the red image. Also, the diffuse emission around the right-hand nucleus is separated in the two images.
These complex distributions of gas, coupled with information on their motions, can be used to better understand the nature of ULIRGs. How is the gas responding to the galaxy merger? How might the gas be fueling the power source within these galaxies? How do the distributions and motions of molecular gas differ from that of atomic gas? Data of the type shown above, for this and other ULIRGs, will bring us closer to understanding these issues.