|
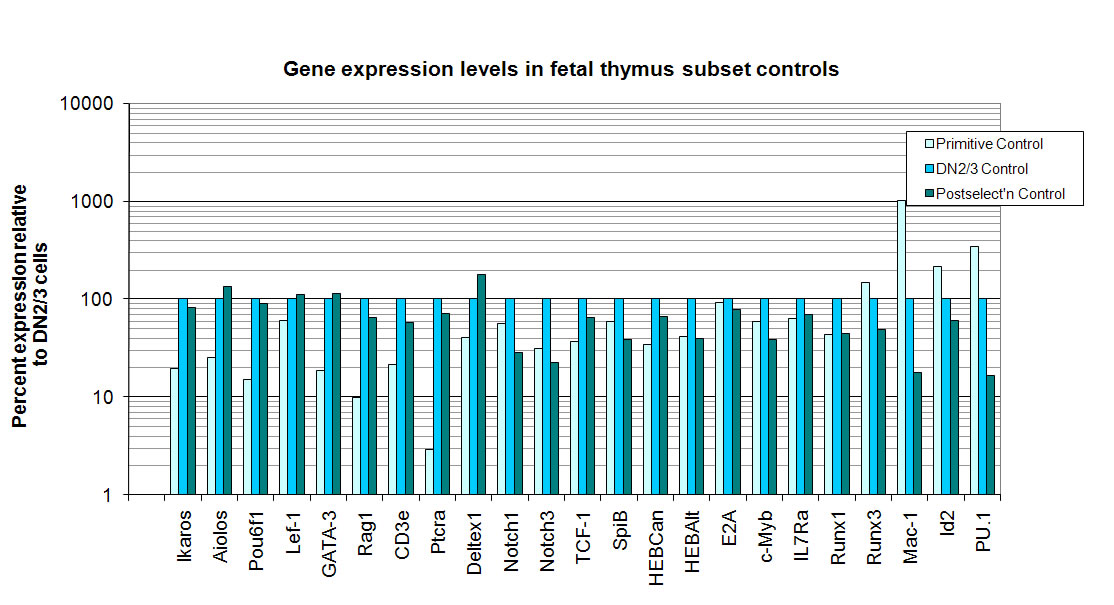
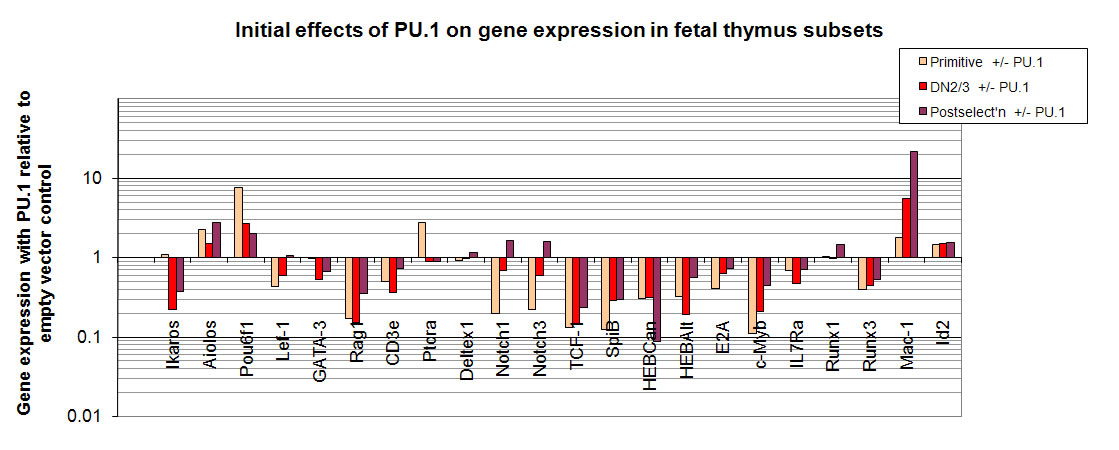
Gene expression relative to control pro-T cells (empty vector Lz, Thy-1+ CD25+), log(10) transformed
|
+/-PU.1
|
Lz |
Lz |
PU.1 |
PU.1 |
Lz |
Lz |
Lz |
PU.1 |
PU.1 |
PU.1 |
Lz |
Lz |
Lz |
PU.1 |
PU.1 |
PU.1 |
|
Stage
|
prmtv |
prmtv |
prmtv |
prmtv |
proT |
proT |
proT |
proT |
proT |
proT |
preT |
preT |
preT |
preT |
preT |
preT |
|
Ikaros
|
-1.14 |
-0.28 |
-0.36 |
-0.99 |
0 |
0 |
0 |
-0.6 |
-0.7 |
-0.67 |
-0.02 |
-0.1 |
-0.13 |
-0.25 |
-0.72 |
-0.57 |
|
Aiolos
|
-1.04 |
-0.16 |
-0.1 |
-0.39 |
0 |
0 |
0 |
0.16 |
0.08 |
0.28 |
-0.13 |
0.05 |
0.45 |
0.26 |
0.65 |
0.78 |
|
Pou6f1
|
-1.21 |
-0.43 |
0.58 |
-0.46 |
0 |
0 |
0 |
0.81 |
0.13 |
0.33 |
0.09 |
-0.35 |
0.13 |
-0.26 |
0.49 |
0.56 |
|
Lef.1
|
0.58 |
-1.03 |
0.27 |
-1.46 |
0 |
0 |
0 |
0.66 |
-0.79 |
-0.55 |
0.74 |
-0.55 |
-0.06 |
0.63 |
-0.33 |
-0.09 |
|
GATA.3
|
-0.95 |
-0.51 |
-0.49 |
-0.99 |
0 |
0 |
0 |
-0.47 |
-0.81 |
0.46 |
-0.16 |
-0.44 |
0.78 |
-0.53 |
-0.35 |
0.52 |
|
Rag1
|
-1.52 |
-0.5 |
-1.39 |
-2.15 |
0 |
0 |
0 |
-0.73 |
-0.83 |
-0.88 |
-0.21 |
-0.32 |
-0.05 |
-0.51 |
-0.75 |
-0.65 |
|
CD3e
|
-0.87 |
-0.47 |
-0.84 |
-1.09 |
0 |
0 |
0 |
-0.38 |
-0.38 |
-0.55 |
-0.15 |
-0.25 |
-0.31 |
-0.19 |
-0.36 |
-0.57 |
|
pTalpha
|
-2.27 |
-0.81 |
-0.84 |
-1.35 |
0 |
0 |
0 |
-0.02 |
-0.08 |
-0.06 |
-0.13 |
-0.3 |
-0.01 |
-0.05 |
-0.45 |
-0.09 |
|
Deltex1
|
-0.27 |
-0.51 |
-0.12 |
-0.74 |
0 |
0 |
0 |
0.22 |
-0.36 |
0.09 |
0.6 |
-0.03 |
0.17 |
0.21 |
0.04 |
0.67 |
|
Notch1
|
-0.24 |
-0.26 |
-0.65 |
-1.26 |
0 |
0 |
0 |
0.06 |
-0.48 |
-0.08 |
-0.58 |
-0.66 |
-0.41 |
-0.28 |
-0.54 |
-0.19 |
|
Notch3
|
-0.7 |
-0.32 |
-0.76 |
-1.56 |
0 |
0 |
0 |
-0.16 |
-0.33 |
-0.17 |
-1.04 |
-0.51 |
-0.39 |
-0.45 |
-0.24 |
-0.64 |
|
TCF.1
|
-0.37 |
-0.5 |
-1.09 |
-1.54 |
0 |
0 |
0 |
-0.78 |
-1.04 |
-0.7 |
-0.2 |
-0.31 |
-0.05 |
-0.95 |
-0.91 |
-0.57 |
|
SpiB
|
-0.22 |
-0.25 |
-1.05 |
-1.22 |
0 |
0 |
0 |
-0.52 |
-0.65 |
-0.43 |
-0.5 |
-0.43 |
-0.3 |
-1.13 |
-1.01 |
-0.67 |
|
HEBCan
|
-0.55 |
-0.39 |
-0.83 |
-1.14 |
0 |
0 |
0 |
-0.46 |
-0.69 |
-0.37 |
-0.28 |
-0.18 |
-0.07 |
-1.7 |
-0.43 |
-1.57 |
|
E2A
|
0.21 |
-0.28 |
-0.16 |
-0.69 |
0 |
0 |
0 |
0.01 |
-0.41 |
-0.22 |
0.04 |
-0.27 |
-0.09 |
-0.29 |
-0.2 |
-0.23 |
|
c.Myb
|
-0.13 |
-0.33 |
-0.94 |
-1.44 |
0 |
0 |
0 |
-0.45 |
-0.96 |
-0.64 |
-0.48 |
-0.57 |
-0.21 |
-0.7 |
-1.02 |
-0.6 |
|
IL7Ra
|
-0.2 |
-0.19 |
-0.04 |
-0.67 |
0 |
0 |
0 |
-0.32 |
-0.51 |
-0.14 |
-0.04 |
-0.32 |
-0.13 |
-0.54 |
-0.31 |
-0.1 |
|
Runx1
|
-0.27 |
-0.46 |
-0.19 |
-0.52 |
0 |
0 |
0 |
0.07 |
-0.25 |
0.13 |
-0.3 |
-0.61 |
-0.14 |
-0.32 |
-0.23 |
-0.01 |
|
Runx3
|
0.35 |
-0.03 |
-0.11 |
-0.37 |
0 |
0 |
0 |
-0.19 |
-0.5 |
-0.35 |
-0.24 |
-0.38 |
-0.31 |
-0.63 |
-0.55 |
-0.59 |
|
Mac.1
|
1.73 |
0.3 |
1.98 |
0.55 |
0 |
0 |
0 |
1.69 |
0.32 |
0.19 |
-0.52 |
-1.37 |
-0.38 |
1.36 |
0.01 |
0.36 |
|
Id2
|
0.57 |
0.1 |
0.74 |
0.26 |
0 |
0 |
0 |
0.37 |
-0.04 |
0.21 |
-0.29 |
-0.39 |
0.03 |
-0.07 |
0 |
-0.03 |
|
PU.1.coding
|
0.73 |
0.35 |
2.3 |
2.04 |
0 |
0 |
0 |
2.21 |
2.2 |
2.24 |
-0.93 |
-1.21 |
-0.21 |
2.48 |
2.02 |
2.26 |
|
HEBAlt
|
-0.05 |
-0.73 |
-1.11 |
-0.65 |
0 |
0 |
0 |
-0.7 |
-0.25 |
-1.2 |
-0.64 |
-0.16 |
-0.42 |
-1.31 |
-0.28 |
-0.4 |
|
GATA.2
|
1.18 |
-2.57 |
-0.63 |
-3.12 |
0 |
0 |
0 |
-1.22 |
-2.67 |
-0.33 |
-0.63 |
-3.07 |
0.24 |
-0.82 |
-3 |
-0.16 |
|
All data from
C.B. Franco, D. D. Scripture-Adams, I. Proekt, T. Taghon, A. H. Weiss, M. A. Yui, S. L. Adams, R. A. Diamond, and E. V. Rothenberg, Proc Natl Acad Sci USA 2006; 103:11993-11998