Data on the short-term effects of removing fetal thymocytes from Notch-Delta interactions
|
Mary Data
| Gene |
LZ.DL |
LZ.ctrl |
sd.DL |
sd.ctrl |
|
PU.1
|
0 |
-0.0562 |
0.1366 |
0.0768 |
|
Deltex1
|
0 |
-2.3673 |
0.0973 |
0.0727 |
|
Hes1
|
0 |
-0.6637 |
0.0876 |
0.0491 |
|
pTalpha
|
0 |
-1.6962 |
0.1119 |
0.0568 |
|
Rag.1
|
0 |
-0.3275 |
0.0568 |
0.0729 |
|
CD3g
|
0 |
-0.2279 |
0.0709 |
0.0461 |
|
CD3e
|
0 |
-0.3486 |
0.021 |
0.0882 |
|
Zap70
|
0 |
-0.1805 |
0.1041 |
0.0147 |
|
Lck
|
0 |
-0.2936 |
0.0352 |
0.0295 |
|
Lat
|
0 |
-0.3247 |
0.056 |
0.1131 |
|
Runx3
|
0 |
0.0836 |
0.0589 |
0.0755 |
|
Runx1
|
0 |
-0.5068 |
0.104 |
0.0454 |
|
FOG.1
|
0 |
-0.1494 |
0.0673 |
0.0533 |
|
GATA3b
|
0 |
-0.1628 |
0.1294 |
0.0803 |
|
TCF.7.8
|
0 |
-6e-04 |
0.1068 |
0.0402 |
|
Ets2
|
0 |
-0.5775 |
0.1356 |
0.0619 |
|
Ets1
|
0 |
0.0341 |
0.1022 |
0.1012 |
|
Ikaros
|
0 |
-0.0904 |
0.1351 |
0.0715 |
|
Gfi1
|
0 |
-0.2836 |
0.1234 |
0.1222 |
|
c.Myb
|
0 |
-0.2667 |
0.0225 |
0.0481 |
|
HEBcan
|
0 |
-0.2318 |
0.0675 |
0.0827 |
|
E2A
|
0 |
-0.2394 |
0.1048 |
0.1528 |
|
Id1
|
0 |
0.0067 |
0.0567 |
0.1098 |
|
Id2
|
0 |
0.1642 |
0.111 |
0.1087 |
|
Id3
|
0 |
0.3916 |
0.1266 |
0.0725 |
|
Bcl11b
|
0 |
-0.2595 |
0.1366 |
0.0742 |
|
C.EBPa
|
0 |
0.0571 |
0.1087 |
0.1499 |
|
C.EBPb
|
0 |
-0.1034 |
0.2325 |
0.2205 |
| Ā |
Ā |
Ā |
Ā |
Ā |
|
GATA.1
|
0 |
-0.1196 |
0.1352 |
0.0202 |
|
GATA.2
|
0 |
0.1524 |
0.1327 |
0.0603 |
|
GATA.3.endog
|
0 |
-0.1538 |
0.0801 |
0.0956 |
|
IL7Ra
|
0 |
-0.1494 |
0.0115 |
0.1334 |
|
LEF.1
|
0 |
-0.5222 |
0.13 |
0.1043 |
|
Sox4
|
0 |
-0.1819 |
0.0439 |
0.0301 |
|
Aiolos
|
0 |
-0.4102 |
0.1272 |
0.2455 |
|
Helios
|
0 |
0.1786 |
0.1142 |
0.1675 |
|
Notch1
|
0 |
-0.7733 |
0.0355 |
0.0434 |
|
Notch3
|
0 |
-1.0476 |
0.0467 |
0.0949 |
|
Nrarp
|
0 |
-0.4469 |
0.4878 |
0.1322 |
|
Mitf
|
0 |
-0.0353 |
0.0755 |
0.0561 |
|
CPA3
|
0 |
0.0776 |
0.1075 |
0.0376 |
|
TpoR
|
0 |
-0.1113 |
0.2972 |
0.2485 |
|
SCL
|
0 |
-0.2297 |
0.0589 |
0.6694 |
|
Gfi1B
|
0 |
-0.8797 |
0.1323 |
0.3406 |
|
Mcpt6
|
0 |
-0.147 |
1.3907 |
1.52 |
|
EBF
|
0 |
0.1763 |
0.2693 |
0.3706 |
|
Pax5
|
0 |
0.7898 |
0.4233 |
0.9294 |
|
Hbb.b1
|
0 |
0.2142 |
0.1531 |
0.0987 |
|
EpoR
|
0 |
-0.5379 |
0.1833 |
0.1134 |
|
Nfe2
|
0 |
-7e-04 |
0.1617 |
0.2169 |
|
Fli1
|
0 |
0.088 |
0.0935 |
0.0628 |
|
HoxB4
|
0 |
-0.066 |
0.3987 |
0.2833 |
|
Chris Data
|
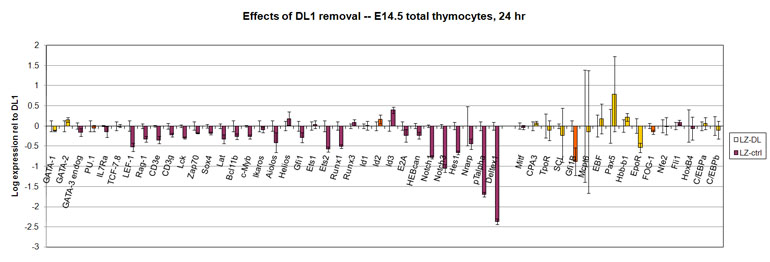
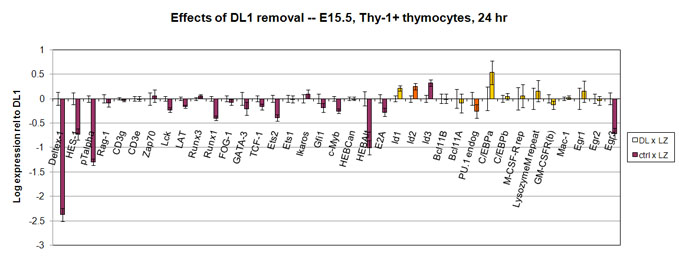
Results are expressed as differences between cells grown under normal, T-cell promoting conditions (OP9-DL) and cells deprived of the Notch ligand DL (OP9-control).
All the samples are from retroviral transduction experiments; they are the empty-vector-transduced controls ("Lz"), and so do not precisely represent fresh fetal thymocytes.
All samples were initially cultured without Notch ligands for ~16 hr overnight for introduction of the vectors (Lz for these samples, PU.1 or GATA3 for additional samples in the studies cited)
and then split to incubate either in the presence of Notch ligands (DL1) or in the absence of Notch ligands ("cntrl") for an additional 24 hr.
In the
Franco et al.
experiment, the cells were then sorted for expression of the empty Lz vector and for expression of blood-cell marker CD45 and T-cell marker Thy-1 before RNA was prepared
In the
Taghon et al.
experiment, the cells were then sorted for expression of the empty Lz vector and for expression of blood-cell marker CD45 only before RNA was prepared; thus some more primitive cells were also included.
All results are log(10) transformed so that no change in expression = 0.
Ā