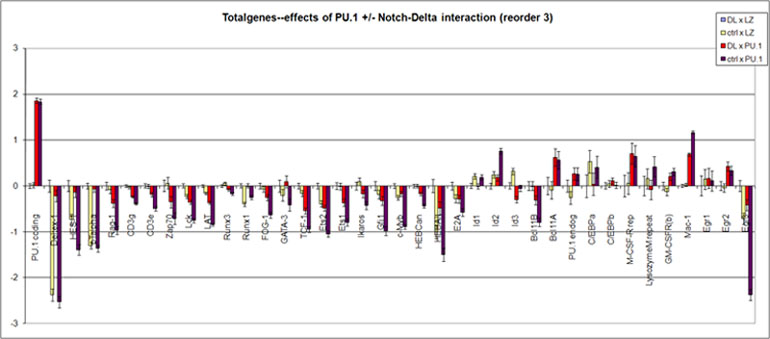
Efects of forced PU.1 expression in fetal thymocytes in the presence or absence of Notch signals
|
Gene expression measured by quantitative real-time RT-PCR
| +/-Notch Ligand |
DL |
DL |
DL |
DL |
DL |
DL |
CTRL |
CTRL |
CTRL |
CTRL |
CTRL |
CTRL |
| +/-PU.1 |
LZ |
LZ |
LZ |
PU.1 |
PU.1 |
PU.1 |
LZ |
LZ |
LZ |
PU.1 |
PU.1 |
PU.1 |
|
PU.1.coding
|
0 |
0 |
0 |
1.98 |
1.86 |
1.74 |
0.08 |
0.1 |
-0.12 |
1.78 |
1.92 |
1.81 |
|
Deltex.1
|
0 |
0 |
0 |
-0.11 |
-0.38 |
-0.16 |
-2.25 |
-2.66 |
-2.21 |
-2.93 |
-2.35 |
-2.3 |
|
HES.1
|
0 |
0 |
0 |
0.05 |
-0.14 |
-0.32 |
-0.97 |
-0.67 |
-0.54 |
-1.72 |
-1.23 |
-1.22 |
|
pTalpha
|
0 |
0 |
0 |
0.07 |
-0.14 |
-0.12 |
-1.3 |
-1.39 |
-1.2 |
-1.39 |
-1.53 |
-1.18 |
|
Rag.1
|
0 |
0 |
0 |
-0.49 |
-0.33 |
-0.33 |
-0.05 |
-0.09 |
-0.12 |
-1.3 |
-0.81 |
-0.8 |
|
CD3g
|
0 |
0 |
0 |
-0.2 |
-0.21 |
-0.29 |
-0.01 |
-0.04 |
-0.05 |
-0.32 |
-0.47 |
-0.38 |
|
CD3e
|
0 |
0 |
0 |
-0.24 |
-0.18 |
-0.14 |
-0.09 |
0.02 |
0.06 |
-0.65 |
-0.45 |
-0.39 |
|
Zap70
|
0 |
0 |
0 |
-0.46 |
-0.41 |
-0.17 |
0.01 |
-0.11 |
0.28 |
-1.08 |
-0.7 |
-0.36 |
|
Lck
|
0 |
0 |
0 |
-0.28 |
-0.36 |
-0.42 |
-0.26 |
-0.32 |
-0.11 |
-0.84 |
-0.76 |
-0.66 |
|
LAT
|
0 |
0 |
0 |
-0.33 |
-0.36 |
-0.4 |
-0.19 |
-0.24 |
-0.06 |
-0.9 |
-0.84 |
-0.78 |
|
Runx3
|
0 |
0 |
0 |
-0.1 |
-0.08 |
-0.05 |
0.07 |
0 |
0.1 |
-0.28 |
-0.12 |
-0.14 |
|
Runx1
|
0 |
0 |
0 |
0.02 |
-0.02 |
0.02 |
-0.35 |
-0.53 |
-0.32 |
-0.29 |
-0.33 |
-0.13 |
|
FOG.1
|
0 |
0 |
0 |
-0.16 |
-0.35 |
-0.26 |
0.01 |
-0.1 |
-0.13 |
-0.85 |
-0.49 |
-0.56 |
|
GATA.3
|
0 |
0 |
0 |
0.18 |
0.14 |
-0.03 |
-0.09 |
-0.35 |
-0.18 |
-0.7 |
-0.61 |
0.06 |
|
TCF.1
|
0 |
0 |
0 |
-0.41 |
-0.65 |
-0.57 |
-0.12 |
-0.22 |
-0.16 |
-1.14 |
-0.88 |
-0.81 |
|
Ets2
|
0 |
0 |
0 |
-0.49 |
-0.4 |
-0.56 |
-0.39 |
-0.4 |
-0.38 |
-1.28 |
-0.84 |
-1.02 |
|
Ets1
|
0 |
0 |
0 |
-0.34 |
-0.24 |
-0.52 |
0.02 |
-0.09 |
0.04 |
-1.04 |
-0.68 |
-0.66 |
|
Ikaros
|
0 |
0 |
0 |
-0.3 |
-0.21 |
-0.02 |
0.04 |
-0.13 |
0.36 |
-0.52 |
-0.41 |
-0.33 |
|
Gfi1
|
0 |
0 |
0 |
-0.27 |
-0.4 |
-0.29 |
-0.26 |
-0.27 |
-0.03 |
-1.31 |
-0.74 |
-0.9 |
|
c.Myb
|
0 |
0 |
0 |
-0.11 |
-0.19 |
-0.23 |
-0.23 |
-0.32 |
-0.2 |
-1.05 |
-0.82 |
-0.8 |
|
HEBCan
|
0 |
0 |
0 |
-0.15 |
-0.16 |
-0.23 |
0.09 |
-0.07 |
-0.01 |
-0.37 |
-0.55 |
-0.39 |
|
HEBAlt
|
0 |
0 |
0 |
-0.89 |
-0.18 |
-0.38 |
-0.97 |
-1.08 |
-0.96 |
-1.56 |
-1.8 |
-1.15 |
|
E2A
|
0 |
0 |
0 |
-0.36 |
-0.29 |
-0.22 |
-0.14 |
-0.43 |
-0.26 |
-0.81 |
-0.6 |
-0.33 |
|
Id1
|
0 |
0 |
0 |
-0.13 |
0.2 |
-0.1 |
0.19 |
0.29 |
0.16 |
0.13 |
0.2 |
0.22 |
|
Id2
|
0 |
0 |
0 |
-0.02 |
0.14 |
0.41 |
0.27 |
0.22 |
0.25 |
0.71 |
0.85 |
0.72 |
|
Id3
|
0 |
0 |
0 |
-0.38 |
-0.24 |
-0.27 |
0.23 |
0.24 |
0.49 |
-0.24 |
0.1 |
-0.03 |
|
Bcl11B
|
0 |
0 |
0 |
-0.12 |
-0.26 |
-0.56 |
0.01 |
-0.2 |
0.18 |
-0.97 |
-0.71 |
-0.69 |
|
Bcl11A
|
0 |
0 |
0 |
0.83 |
0.07 |
0.98 |
0.01 |
-0.36 |
0.07 |
0.77 |
0.13 |
0.8 |
|
PU.1.endog
|
0 |
0 |
0 |
0.08 |
0.02 |
0.69 |
-0.15 |
-0.21 |
-0.41 |
-0.02 |
0.29 |
0.51 |
|
C.EBPa
|
0 |
0 |
0 |
-0.21 |
0.63 |
-0.31 |
0.5 |
1.05 |
0.05 |
0.3 |
0.91 |
0.01 |
|
C.EBPb
|
0 |
0 |
0 |
0.13 |
0.12 |
0.08 |
-0.11 |
0.01 |
0.23 |
-0.09 |
0.21 |
-0.07 |
|
M.CSF.R.rep
|
0 |
0 |
0 |
0.81 |
0.82 |
0.49 |
0.2 |
0.74 |
-0.77 |
0.84 |
0.6 |
0.5 |
|
LysozymeM.repeat
|
0 |
0 |
0 |
-0.07 |
0.08 |
-0.24 |
0.46 |
0.39 |
-0.38 |
0.47 |
0.96 |
-0.17 |
|
GM.CSFR.b.
|
0 |
0 |
0 |
0.3 |
-0.01 |
0.33 |
-0.12 |
-0.18 |
-0.1 |
0.08 |
0.49 |
0.35 |
|
Mac.1
|
0 |
0 |
0 |
0.71 |
0.58 |
0.78 |
-0.01 |
0 |
0.08 |
1.21 |
1.18 |
1.12 |
|
Egr1
|
0 |
0 |
0 |
-0.39 |
0.31 |
0.58 |
-0.26 |
0.42 |
0.28 |
-0.4 |
0.39 |
0.34 |
|
Egr2
|
0 |
0 |
0 |
0.2 |
0.52 |
0.56 |
-0.25 |
0.14 |
-0.02 |
0.16 |
0.33 |
0.51 |
|
Egr3
|
0 |
0 |
0 |
-0.23 |
-0.63 |
-0.39 |
-0.68 |
-1.09 |
-0.38 |
-2.44 |
-2.35 |
-2.33 |
|
Averages of log values
| DL |
DL |
CTRL |
CTRL |
� |
+/-Notch Ligand |
| LZ |
PU.1 |
LZ |
PU.1 |
StdErr |
+/-PU.1 |
| 0 |
1.86 |
0.02 |
1.84 |
0.055 |
PU.1.coding |
| 0 |
-0.22 |
-2.38 |
-2.53 |
0.13 |
Deltex.1 |
| 0 |
-0.14 |
-0.73 |
-1.39 |
0.117 |
HES.1 |
| 0 |
-0.07 |
-1.3 |
-1.36 |
0.066 |
pTalpha |
| 0 |
-0.39 |
-0.09 |
-0.97 |
0.087 |
Rag.1 |
| 0 |
-0.24 |
-0.03 |
-0.39 |
0.028 |
CD3g |
| 0 |
-0.19 |
0 |
-0.5 |
0.047 |
CD3e |
| 0 |
-0.35 |
0.06 |
-0.71 |
0.127 |
Zap70 |
| 0 |
-0.35 |
-0.23 |
-0.75 |
0.045 |
Lck |
| 0 |
-0.36 |
-0.16 |
-0.84 |
0.033 |
LAT |
| 0 |
-0.08 |
0.05 |
-0.18 |
0.03 |
Runx3 |
| 0 |
0.01 |
-0.4 |
-0.25 |
0.045 |
Runx1 |
| 0 |
-0.26 |
-0.07 |
-0.63 |
0.065 |
FOG.1 |
| 0 |
0.09 |
-0.2 |
-0.42 |
0.129 |
GATA.3 |
| 0 |
-0.54 |
-0.17 |
-0.94 |
0.062 |
TCF.1 |
| 0 |
-0.48 |
-0.39 |
-1.04 |
0.067 |
Ets2 |
| 0 |
-0.36 |
-0.01 |
-0.8 |
0.076 |
Ets1 |
| 0 |
-0.18 |
0.09 |
-0.42 |
0.088 |
Ikaros |
| 0 |
-0.32 |
-0.19 |
-0.98 |
0.095 |
Gfi1 |
| 0 |
-0.18 |
-0.25 |
-0.89 |
0.049 |
c.Myb |
| 0 |
-0.18 |
0 |
-0.43 |
0.039 |
HEBCan |
| 0 |
-0.48 |
-1 |
-1.5 |
0.144 |
HEBAlt |
| 0 |
-0.29 |
-0.28 |
-0.58 |
0.083 |
E2A |
| 0 |
-0.01 |
0.21 |
0.18 |
0.058 |
Id1 |
| 0 |
0.18 |
0.24 |
0.76 |
0.066 |
Id2 |
| 0 |
-0.3 |
0.32 |
-0.06 |
0.068 |
Id3 |
| 0 |
-0.31 |
0 |
-0.79 |
0.096 |
Bcl11B |
| 0 |
0.62 |
-0.09 |
0.57 |
0.19 |
Bcl11A |
| 0 |
0.27 |
-0.26 |
0.26 |
0.137 |
PU.1.endog |
| 0 |
0.04 |
0.53 |
0.41 |
0.246 |
C.EBPa |
| 0 |
0.11 |
0.04 |
0.02 |
0.07 |
C.EBPb |
| 0 |
0.71 |
0.06 |
0.65 |
0.233 |
M.CSF.R.rep |
| 0 |
-0.08 |
0.16 |
0.42 |
0.216 |
LysozymeM.repeat |
| 0 |
0.2 |
-0.13 |
0.31 |
0.082 |
GM.CSFR.b. |
| 0 |
0.69 |
0.02 |
1.17 |
0.035 |
Mac.1 |
| 0 |
0.17 |
0.15 |
0.11 |
0.218 |
Egr1 |
| 0 |
0.43 |
-0.04 |
0.33 |
0.095 |
Egr2 |
| 0 |
-0.41 |
-0.72 |
-2.38 |
0.12 |
Egr3 |
|
All effects measured at 40 hr after introduction (~16 hr of infection in absence of stroma + 24 hr in presence of OP9-DL1 cells with or without DL1 expression)
Data for independent biological triplicates expressed relative to control (DL, LZ) in log(10) transformation
All published in:
C.B. Franco, D. D. Scripture-Adams, I. Proekt, T. Taghon, A. H. Weiss, M. A. Yui, S. L. Adams, R. A. Diamond, and E. V. Rothenberg, Proc Natl Acad Sci USA 2006; 103:11993-11998