Experiment 5
September 1994
Pauli introduced two concepts in 1924 to explain hyperfine structure found in some optical spectra; a nuclear angular momentum, and a nuclear magnetic moment. Precise experimental demonstration of the validity of these concepts was not possible with the then existing optical techniques. It was not until molecular-beam techniques were devised by Stern and Gerlach (Germany 1933), and refined by Rabi, Millman, Zacharias, and Kusch (Columbia University 1939), that a precise determination of a nuclear magnetic moment was possible. Utilization of experimental techniques developed during World War II permitted two experiments to be reported independently in 1946, by Purcell, Torrey, and Pound (Nuclear Magnetic Absorption) at Harvard University, and Bloch, Hansen, and Packard (Nuclear Induction) at Stanford University. The Purcell group's method was to measure the energy absorbed by a bulk sample at resonance, while Bloch's examined the signal transferred between orthogonal coils by a bulk sample at resonance. The simpler absorption technique (as refined by Bloembergen, Purcell, and Pound) is the one used for this experiment, with the experimental arrangement illustrated in Fig. 1.
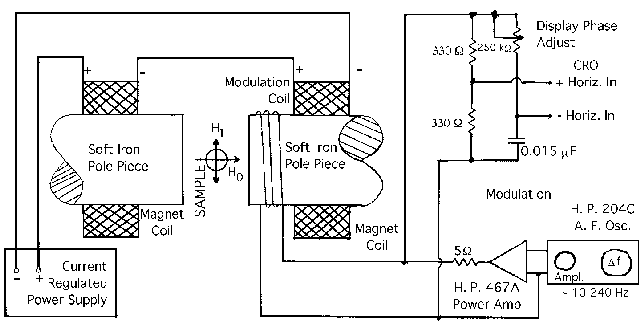
Figure 1. Nuclear Magnetic Resonance Absorption apparatus showing major components.
If we have a nucleus of magnetic moment mu and nuclear spin I, the relationship between the magnetic moment and angular momentum is:

where gamma_N is the nuclear gyromagnetic ratio, g_N is the nuclear "g" factor, and beta_N is the nuclear magneton  .
.
In a magnetic field H_0, the potential energy of the dipole is:
 .
.
The energy levels for the nuclear dipole in the magnetic field are therefore:
 .
.
where m is the magnetic quantum number which takes the values -I, -I+1, -I+2, ...+I. The separation between levels is g_N beta_N H_0. Since the allowed transitions of the dipole for interactions with electromagnetic radiation are given by deltaI = ± 1, the transition energy, delta E, is also g_N beta_N H_0. The transition frequency is:
 .
.
Now consider a sample containing many such nuclei. Assume that the atoms of the material do not have any permanent electronic magnetic moments. The nuclei of the sample interact with each other only weakly, and even more weakly with the atomic system, termed the "lattice" in this situation, even though it is a liquid or gas.
The material to be investigated is immersed in a strong homogeneous magnetic field, H_0. The two sample nuclei, hydrogen (protons) and fluorine, used for this experiment both have non-zero magnetic moments, and a spin of I = 1/2. The randomly oriented spins are aligned by a large magnetic field H_0. The instant H_0 is applied, the nuclei are equally divided between the two quantum states. There is a continual shifting between states caused by thermal energies much larger than E_m that perturb the nuclei through the weak interaction between the magnetic fields of the nuclei and the magnetic fields of the electrons of the atoms of the sample. The effect termed the spin-lattice interaction provides the means of interchanging energy between the nuclei and their environment, and is described by the time constant T_1, the spin-lattice relaxation time.
Eventually, at equilibrium, the nuclei are divided according to the Boltzmann distribution that is appropriate to E_m and the absolute temperature of the sample. A slightly greater number of the nuclei will be in the lower energy state. The excess number in this lower state delta N will be approximately:
 .
.
where N_0 is the total number of nuclei in the sample, and k is the Boltzmann constant. A 1 cm^3 sample of H_2O at 300K containing 10^22 protons will have an excess population of delta N~10^16 in a field of 4 kGauss. The time required to reach this equilibrium value is determined by the spin-lattice interaction.
If the nuclei are now exposed to a small magnetic field H_1 that is oscillating at a radio frequency (RF) and is at right angles to H_0:
 .
.
transitions are stimulated between the energy levels with equal probability that a nucleus will absorb a quantum of energy as emit one. The excess population in the lower energy state insures that there will be a net absorption of energy (at least initially) from the RF field. The RF energy tends to equalize the population difference (reducing the rate of absorption), while the spin-lattice interaction operates so as to maintain the excess population in the lower state.
This description is not exact, as it assumes that the proton is in either the up or the down state at all times, which it is not. In reality, the magnetic field of the applied radiation causes each proton to oscillate between levels of greater and lesser probability for being found in either state. The amplitude of these oscillations is large only when the frequency of the applied radiation is such that its quantum energy is close to that of the energy splitting between the two spin levels. Further, the period of these oscillations is inversely proportional to the strength of the applied radiation, which gives the expected result that in the limit of no applied radiation, each proton is in either the up or down state. (See Cohen-Tannoudji, Quantum Mechanics, Vol. 1)
Experimentally this requires as large a value for H_0 as possible, while, restricting H_1 to a level reasonable for the value of T_1 for the sample. Excessive H_1 levels "saturate" the sample, resulting in a reduced rate of energy absorption (signal). This is avoided when determining the magnitude of a nuclear moment, but is utilized to determine the spin-lattice relaxation time (T_1) for a material. The rate of energy absorption can be increased by "doping" the sample (adding a paramagnetic ion) to improve the "thermal coupling" between the nuclei and their environment, the lattice. Adding a very small quantity of copper sulfate to pure water will reduce T_1 from 2.3 seconds to ~10 msec.
The practical uses for this phenomenon are for determining the value of nuclear magnetic moments by comparison with the proton, the measurement of magnetic fields, and most recently for medical diagnostics. The gyromagnetic ratio (g) for the protons in water has been determined by the National Institute of Standards and Technology to be:
 .
.
This gives:  .
.
A simplified diagram of the electronic setup is shown in Figure 2. An electromagnet with 10 cm diameter pole caps provides the large uniform static field H_0. Two low-resistance field coils, connected in series adding, are driven by an adjustable current-regulated power supply (10 Amperes typical, 15 A Maximum) to provide stable fields of up to ~5 kG. A single supplementary coil has been installed on one magnet pole to allow modulation of the static field at audio frequencies. A voltage, proportional to the amplitude of this modulation, is fed to a constant amplitude phase shifter and then to the horizontal axis of an X-Y oscilloscope (CRO).
 .
.
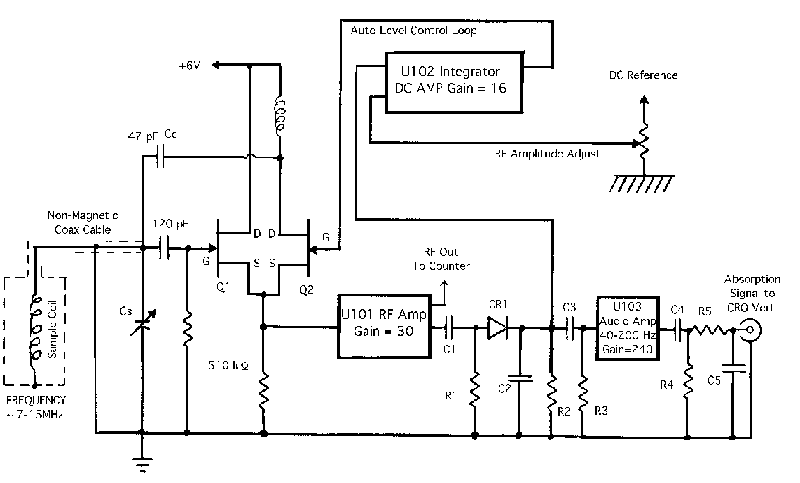
Figure 2. Block diagram of a Nuclear Magnetic Resonance Spectrometer. The S/N ratio of the displayed signal is optimized by the cascaded high-pass (C1/R1, C3/R3, and C4/R4) and low-pass (R2/C2 and R5/C5) filters.
The magnet has been modified and adjusted to produce a highly homogeneous magnetic field over a relatively large volume (~1.5 cm^3) at the center of the gap. This has required using high-purity low-remanence iron for the pole-pieces, and finishing the faces flat to optical tolerances (~1-2 wavelengths). The pole-pieces have not been rigidly attached to the main magnet H-frame, realistic machining tolerances making this impractical. Instead a Neoprene rubber (0.8 mm) spacer has been inserted between each pole-piece and the frame. Careful adjustment of the three fixing screws for each pole-piece varies the compression of the Neoprene so that the pole faces may be adjusted to be precisely parallel, thus maximizing the volume of best field homogeneity. A field homogeneity better than 1 part in 10,000 over a volume of ~2 cm^3 has been achieved.
A sample coil is mounted centrally in the gap of the magnet. A short length of NON-MAGNETIC low-capacity coaxial cable is used for connection to the electronics chassis.
The RF Oscillator/Detector circuitry used for this spectrometer is a solid-state version of the Marginal Oscillator spectrometer developed by Pound, Knight, and Watkins. The heart of the oscillator consists of a differential pair of low-noise high-frequency JFETS (Junction Field Effect Transistors). The operating frequency is determined by the inductance of the sample coil and the shunt capacity in parallel with it, part of which is adjustable (C_s), permitting an operating frequency range from ~ 7 to 18 MHz. Oscillations are produced by use of positive feedback supplied through the capacitor C_c. The RF (Radio Frequency) signal appearing at the JFET's Source is amplified (~ 30X) by a high-frequency amplifier (IC U101), and then rectified by the Schottky-barrier diode (CR 1) with the RF filtered out by the 56 k Ohm/0.047 microF RC network (R_2C_2).
This detected signal, containing a DC component proportional to the average RF level across the sample coil, and an AC component that carries information about the energy absorbed by the sample, is then fed to U102 and U103. The filtered signal and a stable DC level derived from the RF AMPLITUDE ADJUST potentiometer are compared by U102, a high-gain operational amplifier connected as an Integrator. The difference between these signals is amplified (~16X) and further filtered (integrated) to reduce noise and any remaining AC components before being applied to the gate of Q2 to maintain the amplitude of the RF oscillations essentially constant over the operating frequency range.
The low-frequency modulation of the RF signal (due to absorption of energy by the nuclei in the sample) is further amplified by U103, a low-noise/high-gain AC amplifier, for examination on the CRO. U103 is an AC Integrator whose bandwidth has been shaped to maximize the signal-to-noise ratio of the absorption signal. A low-impedance RF output is provided by the emitter follower to permit a frequency measurement while minimizing loading effects on the sensitive RF circuitry.
The operating frequency is measured with a precision Frequency Counter. This unit has a l0 mV input sensitivity over the range from DC to 80 Mhz, a > 7-digit display, frequency measurement sampling times from 100 ms to 10 s, and a crystal time base adjusted to within an error of < +/- 3 x 10^-6 .
1. The resonance dips can be difficult to find. The following procedure is suggested. Install the machine oil sample between the poles of the magnet. Set the RF level knob at about 100 (1000 full scale), and the 20-40 Hz modulation field amplitude (Osc. output control) to about mid-level. Set the RF frequency to > 12 MHz (measure it with the counter), and verify that the entire Lissajous pattern can be seen on the CRO. Disconnect the counter and make very small adjustments of the frequency to obtain a flat trace on the CRO. SLOWLY increase the DC current to the electromagnet until double resonance dips are seen. The dips are easily missed if the current is increased too rapidly and/or the modulation amplitude is too small. You should not exceed 15 Amperes from the DC power supply. Also, be sure the counter probe is disconnected from the electronics chassis before you attempt to find the peaks, as the counter injects spurious noise into the NMR electronics.
2. Observe the behavior of the pattern as the RF level is varied, as frequency is varied, as the DC magnetic field is varied slightly, as the RF coil is moved away from the center of the gap, and as the modulating field amplitude and frequency are varied. Explain your observations. Why are there two dips?
3. Optimize the signal by adjusting the RF level, the modulating field amplitude (minimum practical), the X-Y scales of the CRO, and the position of the sample between the magnets. Explain the shapes of the dips. What causes the ringing (or "wiggles") that follow the main resonance dip (See References 1. and 2.) ?
4. Using the frequency counter, and the relationship between the field and the frequency, you can calibrate the CRO trace in Gauss. Measure the width in Gauss of the modulating field with the modulating current at a large value. Estimate the width at half maximum of the resonance peaks. Why are they so wide? Does the width depend upon the position of the coil in the magnet?
5. The ratio of mu_F / mu_H can be determined by comparing the resonance frequencies of H (protons) and F in the same magnetic field. Install the solid Teflon (TFE) sample, and find the weak fluorine resonance (Set the RF level high and the modulation level very high). Without altering either the static (H_0) or modulating fields, the RF level, or the position of the coil in the magnet gap, replace the Teflon with machine oil, and measure the resonant frequency for protons (carefully adjust the frequency) in the same field. Note, and describe, observed differences between the F and H resonances. From these measurements, determine the value of mu_F / mu_H. Compare your result with Leighton, Principles of Modern Physics, p. 738. What factors contribute to the uncertainty of your results?
6. If you were to increase the operating frequency of the oscillator exactly two times, by what factor must you increase the magnet current so as to re-establish resonant conditions? Is there a "simple" relationship? Explain in some detail.
Copies of the original Physical Review papers on Nuclear Resonance by Bloembergen, Purcell, and Pound as well as Bloch, Hansen, and Packard are available in the laboratory. Various other reprints covering experimental techniques are also available in the laboratory.
